Graph Explorer
The Graph Explorer enables interactive exploration of data within Timbr’s ontology-based semantic layer through a visual graph interface. For a complete tutorial on using Graph Explorer with sample data, see the Supply Chain Use Case Tutorial - Graph Exploration.
It visualizes the virtual knowledge graph defined in Timbr, allowing users to explore business entities, relationships, and dependencies as connected nodes and edges. This makes it easier to uncover patterns, understand relationships, and navigate complex data structures without writing SQL.
Graph Explorer helps users gain insights into how data is connected, investigate specific data points, and explore sequences of events directly through the semantic layer.
Getting Started
The Graph Explorer can be accessed by clicking on the Visualize tab and selecting Graph Explorer.
The starting point in the Graph Explorer after selecting the desired knowledge graph is to create your initial query. This can be accomplished in one of two ways:
- In the default tab called Natural Language Query which is a controlled natural language interface which allows for a more natural language approach.
- In the Visual Query tab which offers a user-friendly interface complete with dropdown menus for selection.
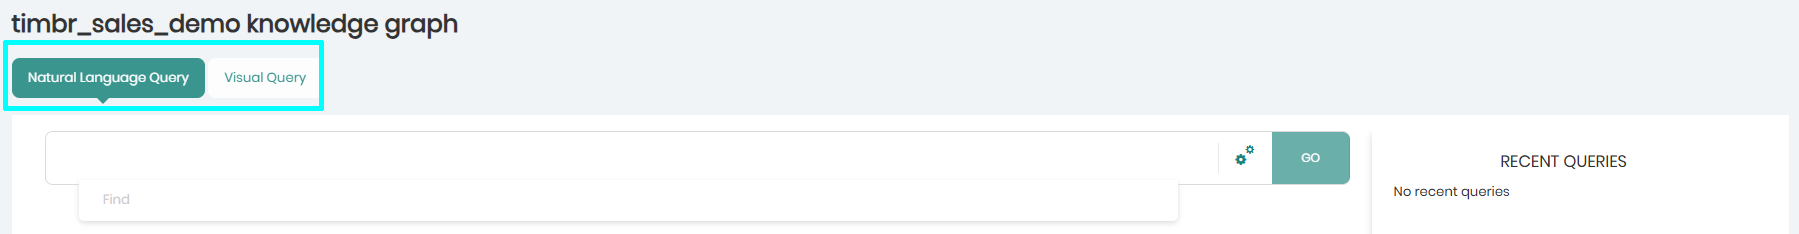
Natural Language Query tab
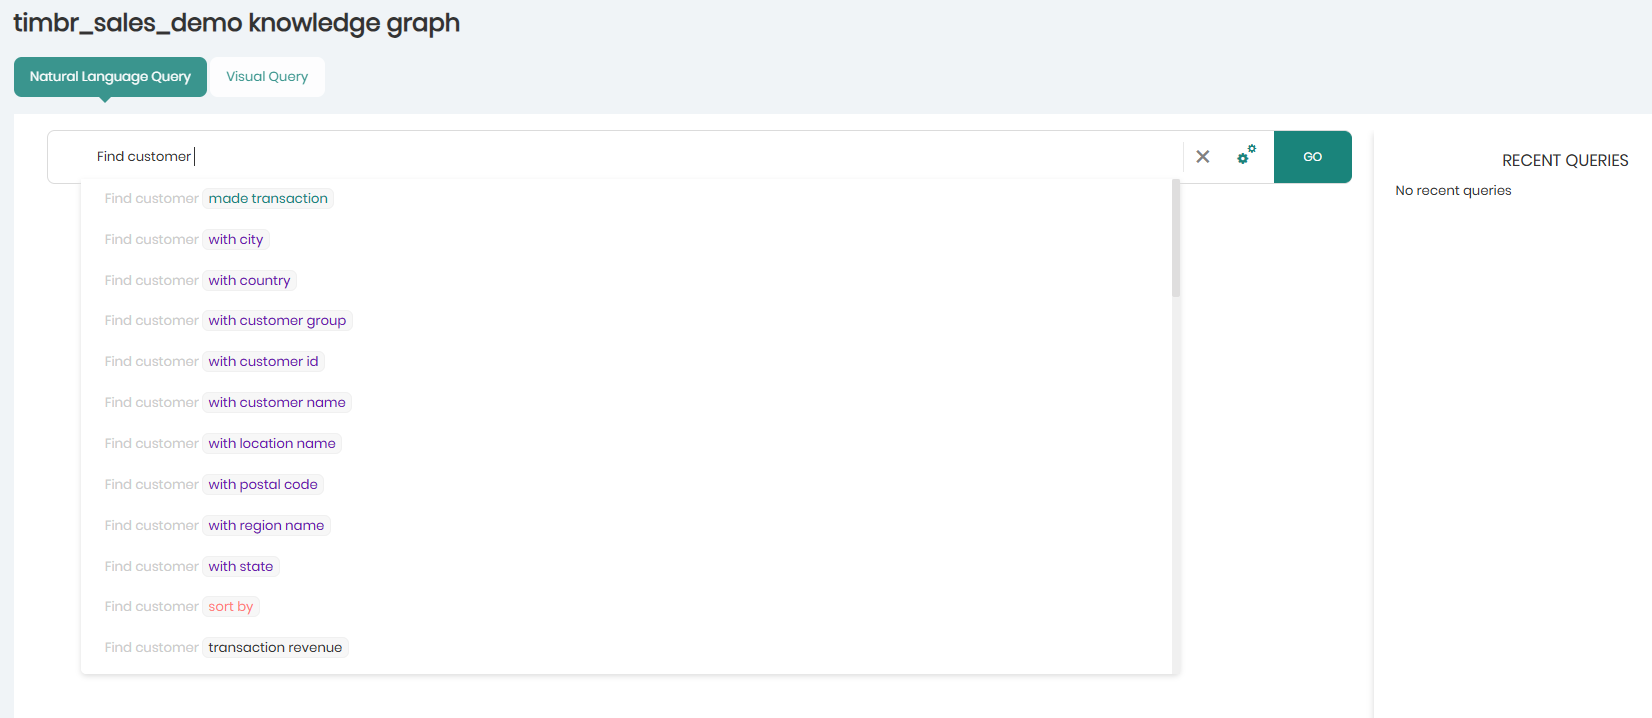
The Natural Language Query tab enables the creation of queries in a controlled natural language approach based on the specific terminology defined in the ontology. The query begins with the word find followed by the initial concept you are querying as defined in the ontology. After this, you can either manually complete the query or select from the autocomplete options provided by Timbr.
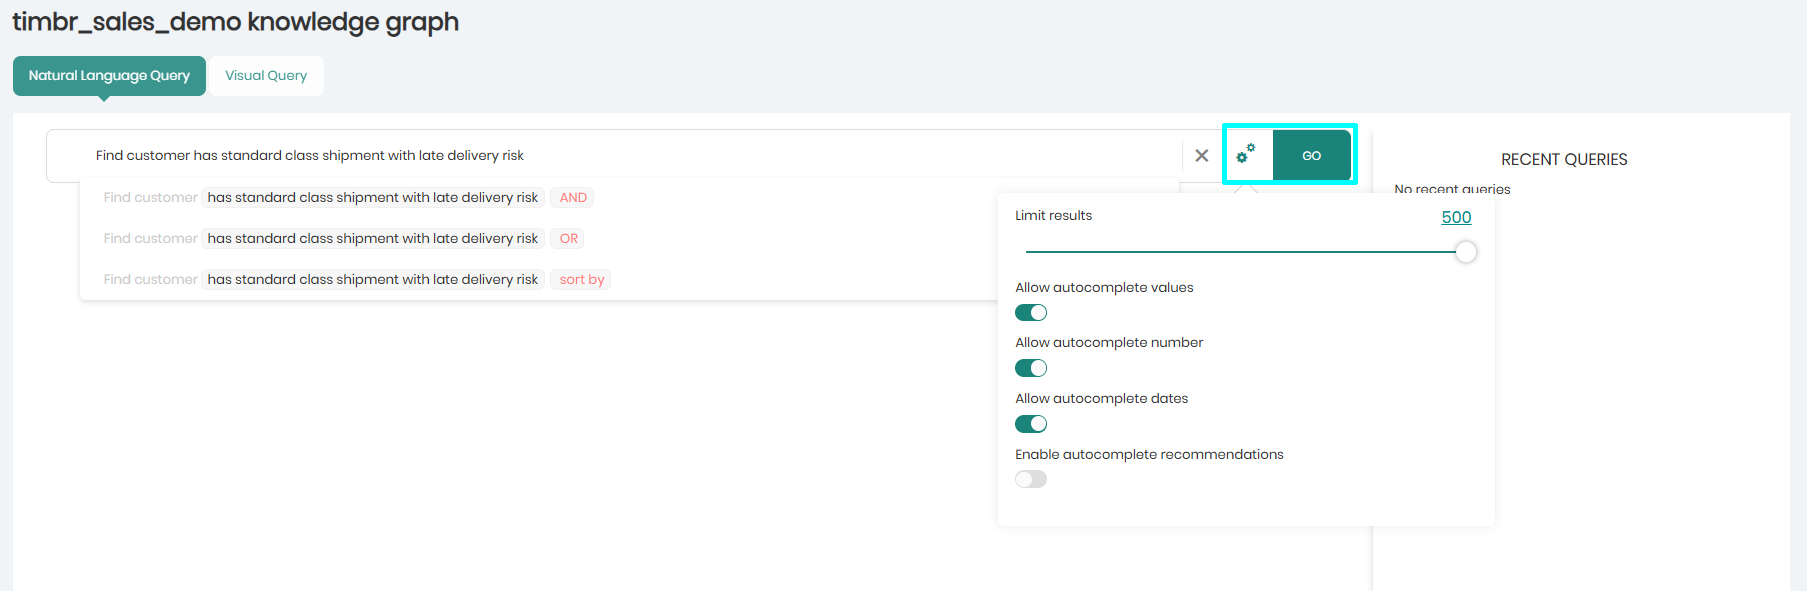
Once find is entered followed by an appropriate concept, the autocomplete function will offer suggestions based on the ontology. These suggestions include properties of the concept, relationships to other concepts, data values and various logical operators such as 'sort by', 'equals', 'AND', 'OR', etc.
Once the query is finalized, settings can be adjusted prior to execution. To the right of the query field, a settings button provides the ability to display different auto complete options as well as set a result query limit. The query is executed by clicking on the GO button, located to the right of the query field.
Once Go is clicked, The query will appear on the graph in the form of data nodes.
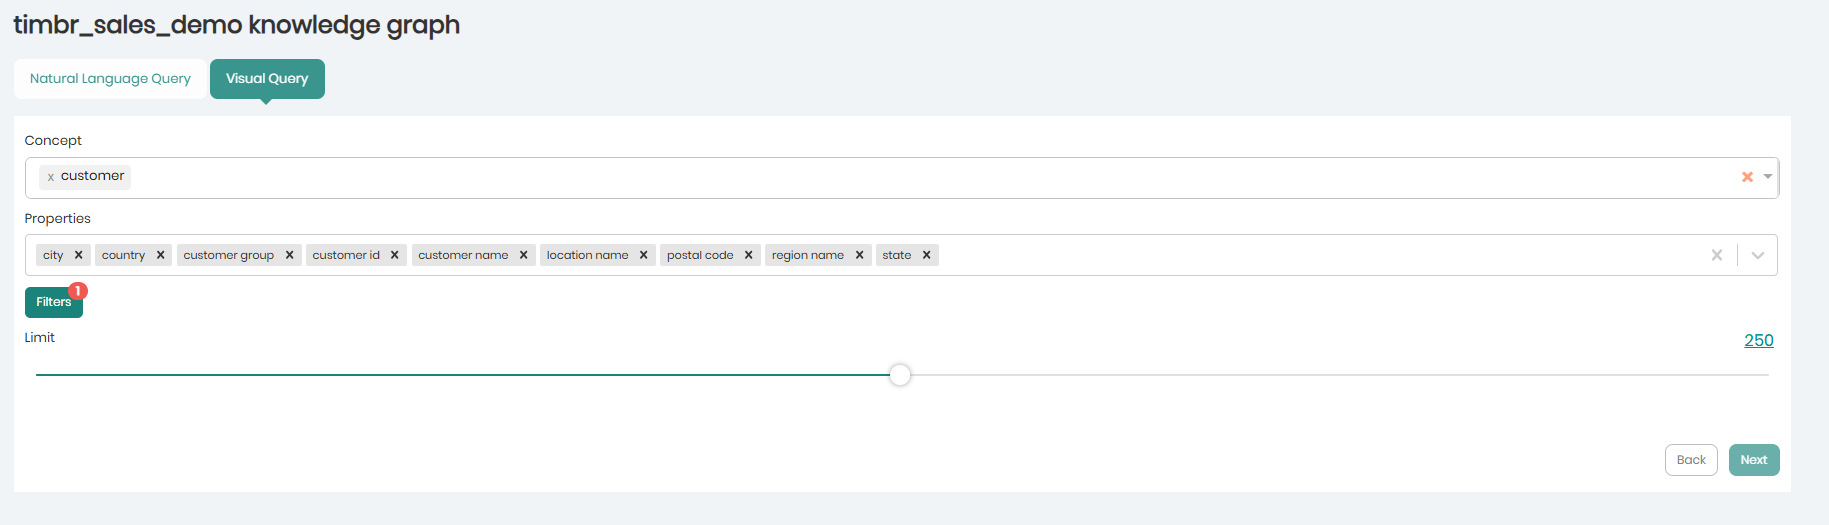
Visual Query tab
The Visual Query tab enables the creation of queries with a user-friendly query builder with dropdown menus to choose a concept, its properties, filters, and a limit to the query.
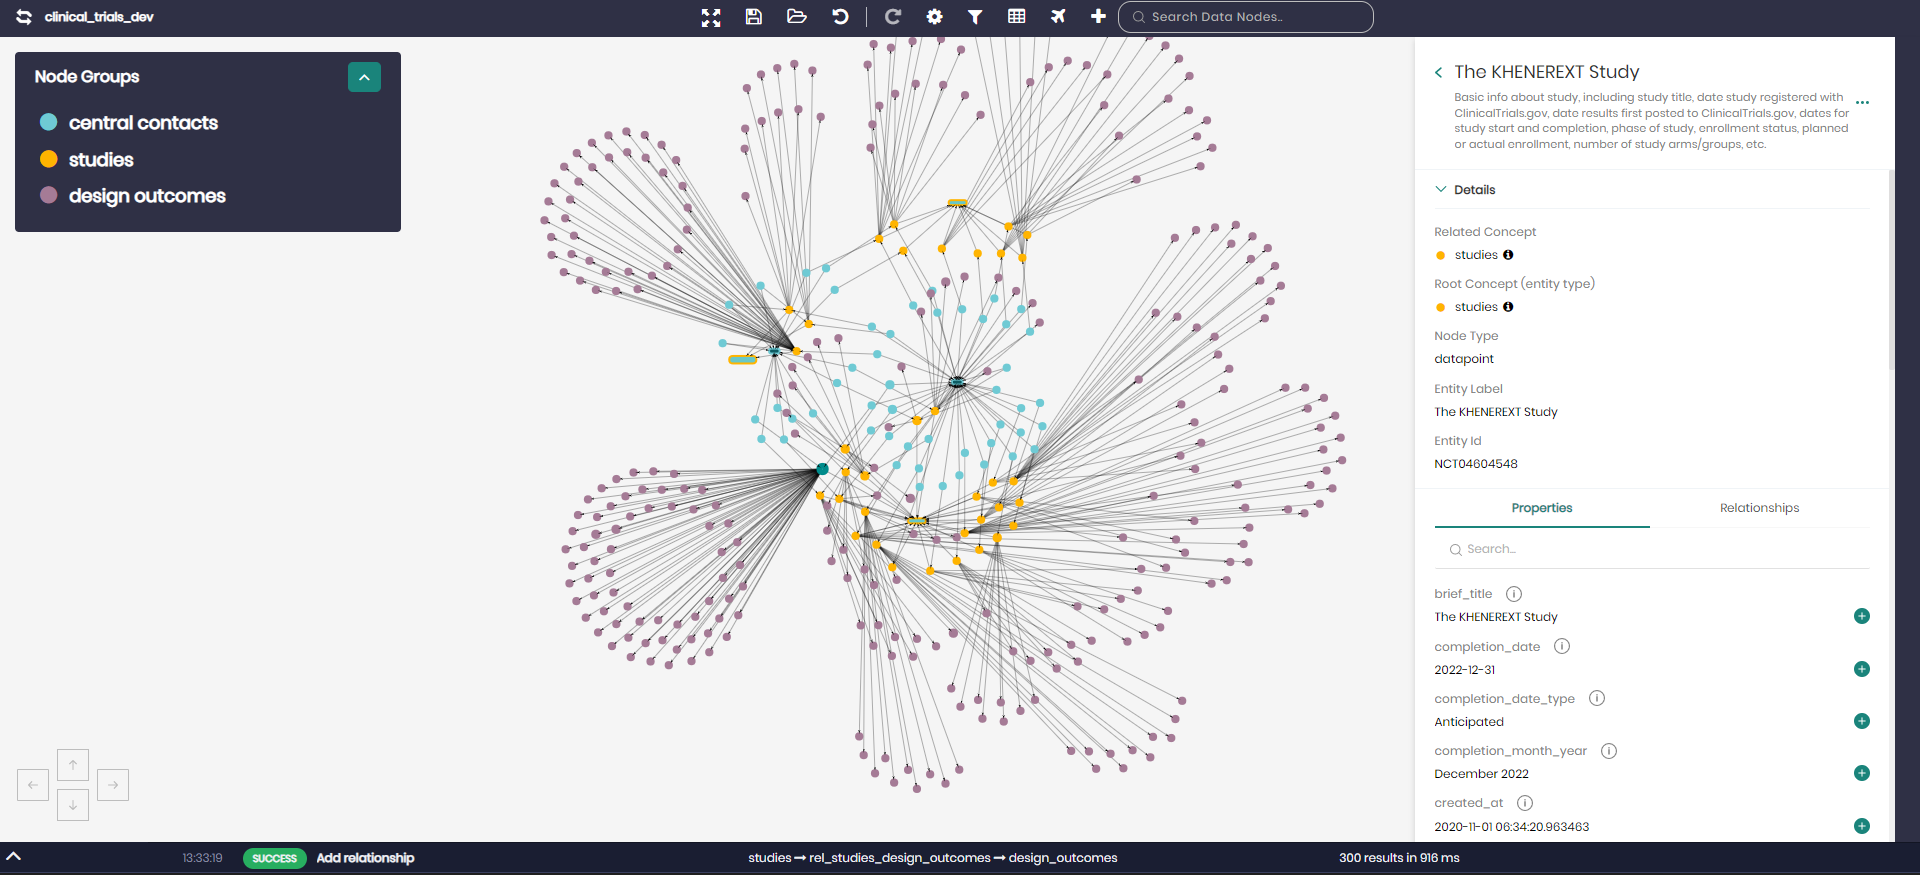
After the initial query is created using either the Visual query builder or the Natural Language Query interface, the executed query displays the resulting data points as nodes on the graph. Each node on the graph represents a data point or a data point property (attribute).
The components of the graph explorer are as follows:
Main Graph View
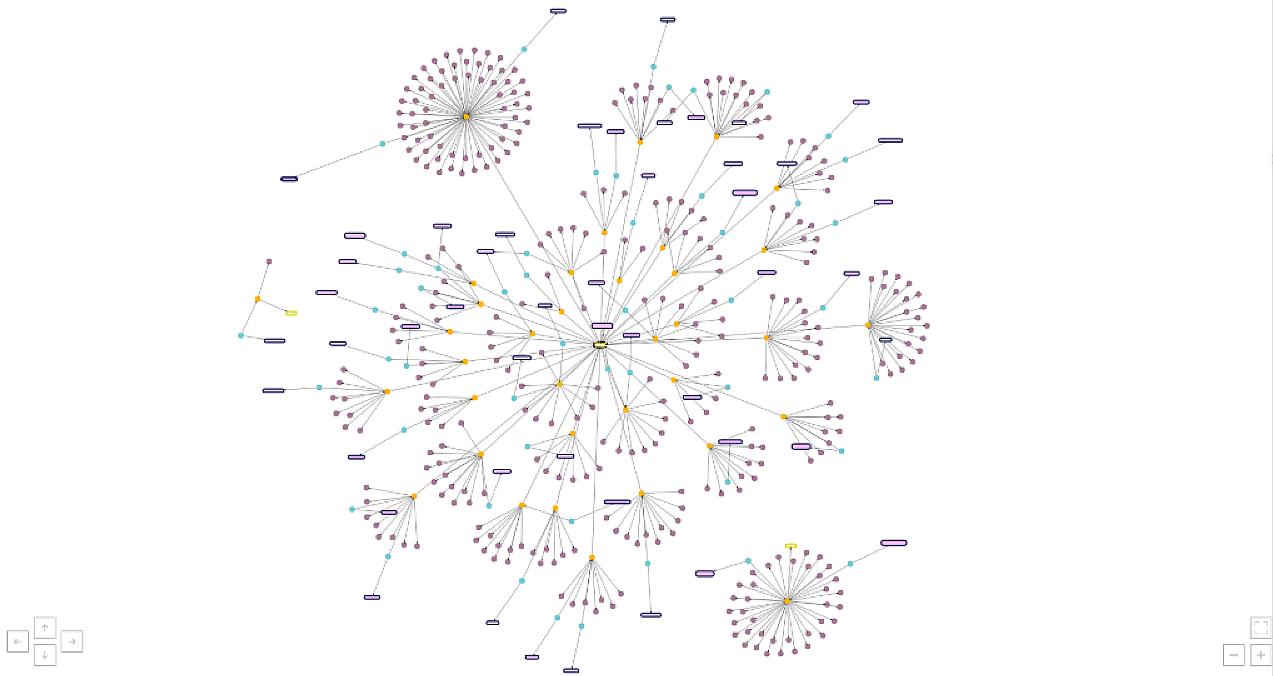
An interactive graph representing the nodes as data points and relationships as edges. You can zoom-in and zoom-out of the graph view by using the mouse wheel.
Main Graph Control
![]()
The main graph control can be found above the graph and controls all things related to the ontology and the graph as a whole. This includes:
Change knowledge graph - Allowing to transfer and explore any other knowledge graph.
New Exploration - Opens a new exploration for the selected knowledge graph.
Save Exploration - Saves the status of the current exploration.
Fullscreen/Exit Fullscreen - For entering and exiting full-screen mode.
Open a saved graph - Opens a list of all the saved explorations to choose from. Once chosen the saved exploration will be added to the graph.
Undo/Redo - Undo the graph state to a previous state or Redo the following action.
Grow Selection - Clicking on Grow Selection after a node has been selected will highlight all connected nodes of the selected node as well.
Shrink Selection - Clicking on Shrink Selection after multiple nodes are selected will remove the highlight from all connected nodes, reverting to only the originally selected node.
Graph settings - Opens a window with different graph settings including:
- Physics - This setting can be set to Auto, On or Off, determining whether the nodes on the graph will automatically stop moving based on the timeout chosen right below physics, move constantly or perhaps not at all.
- Automatic graph functions - These functions run automatically on the graph and include the following functions:
- None - Graph Explorer will not run any queries or try to automatically infer any relationships between the nodes in the graph.
- Fetch properties of all nodes after graph traversals - Graph Explorer will automatically retrieve and display all available properties for the nodes returned after each traversal in the graph.
- Infer similar properties and relationships - Graph Explorer will automatically add nodes and edges to all nodes that have at least one or more relationships to other nodes in the graph.
- Retraverse similar properties and relationships - Graph Explorer will automatically traverse the same relationships of existing nodes in the graph when introducing new nodes of the same group that exist in the graph.
- Retraverse and infer similar properties and relationships - Perform both automatic functions as described above.
- Node Shape - Choose the shape of the nodes, current options are dot, box, circle, star, ellipse and square.
- Node Scaling - Choosing to scale the node sizes based on
different parameters, the current options are:
- Incoming and outgoing relationships
- Incoming relationships
- Outgoing relationships
- By a specific property
- Constant (default)
- Page rank algorithm
- Between centrality algorithm
- Node size - The node sizes can be manually adjusted using the slider.
- Layout - Choose the layout of the graph from:
- Free-form - The default layout view of the graph.
- Hierarchy - A hierarchy layout view of the graph that when chosen has the following options available:
Direction - The direction of the relationships in the graph should be one of the following options:
- Up -> Down
- Left -> Right
- Down -> Up
- Right -> Left
Sort - The algorithm used to ascertain the levels of the nodes based on the data. Sort contains two options:
- Hubsize - Takes the nodes that have the most relationships and puts them at the top. From that point, the rest of the hierarchy is evaluated.
- Directed - Adhere to the relationships in the data (the edges).
Shake To - Controls what is the source in the directed layout. There are two options:
- Roots - When all the root nodes are lined up at the top and their child nodes are as close to their root parents as possible.
- Leaves - When all the leaves are lined up at the bottom and their parent nodes are as close to their children as possible.
Level Space - The spacing between the node levels on the graph.
Node Space - The spacing between nodes in the graph.
Tree Space - The spacing between trees (a group of connected nodes) in the graph.
Once settings are modified Save must be clicked to save the changes. To return to the graph’s default settings, Reset to default should be selected on the top right corner of the graph settings window.
Graph Node Actions - Enables to filter the graph by relationships, properties and other general attributes, with the ability to show, hide, or group any attribute on the graph.
Fetch all groups properties - Adds all the properties to all the node groups on the graph, if they haven’t already been added using the query builder earlier.
Find data connections - This enables traversing the graph using relationships and properties.
Add data nodes - Add data points as nodes to the graph like in the initial query screen. Choose a concept, properties, filters and limit to add to the graph.
Search data nodes - A text search bar for searching specific data nodes on the graph.
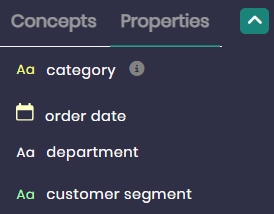
Node Groups Control
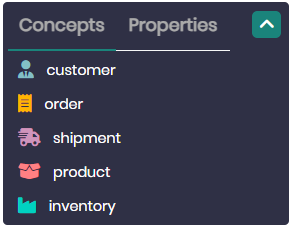
The node groups control is located at the top left of the Graph Explorer and features two tabs. The first tab, Concepts, displays a list of node groups (concepts) included in the graph. The second tab, Properties, shows a list of all properties that appear on the graph.
Concepts tab
In the node groups control, under the Concepts tab, you can change node group settings, cluster nodes to a group, add properties to concept groups, or traverse the graph using relationships and properties from a chosen node group.
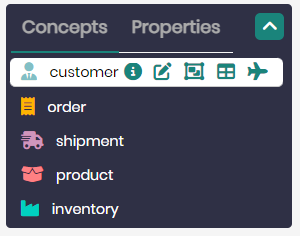
When hovering over a concepts node group the following options will reveal themselves:
Information - displays the description of the concept group that was defined when creating the concept.
Node Group Settings - Opens a window with different node group settings including:
- Node Label - This allows you to change and choose the label you would like to have representing your node group’s data points.
- Node color - Choosing the color of the nodes in the selected group.
- Node label color - Choosing the label color for the nodes in the selected group.
- Node Shape - Choosing the shape of the nodes in the chosen group, current options are dot, box, circle, star, ellipse and square.
- Node Scaling - Choosing to scale the group node sizes based on
different parameters, the current options are:
- Incoming and outgoing relationships
- Incoming relationships
- Outgoing relationships
- By a specific property
- Constant (default)
- Page rank algorithm
- Between centrality algorithm
Once the node group settings are modified Apply must be clicked to apply the changes. To return to the default settings, Reset to default should be selected at the bottom of the node group settings window.
Cluster Nodes - Cluster a group of nodes into a single node, and then count the number of nodes in that group. To un-cluster the nodes, click on the cluster.
Fetch all group properties - Adds all the properties to the data points of the selected node group, if they haven’t already been added using the query builder earlier.
Find data connections - This enables traversing the graph using relationships and properties of the selected node group.
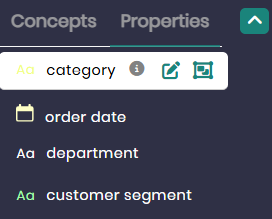
Properties tab
In the node groups control, under the Properties tab, you can change property node color settings, or cluster a group of property nodes into a single node.
When hovering over a properties node group the following options will reveal themselves:
Information - displays the description of the property that was defined when creating the concept.
Change property color - Opens a window where you can edit various color settings for the selected property node group. Options include changing the node’s background color, border color, and the colors used when the node is highlighted or hovered over.
Cluster Nodes - Clusters a group of property nodes into a single node, and then counts the number of nodes in that group. To un-cluster the nodes, click on the cluster.
Node Properties
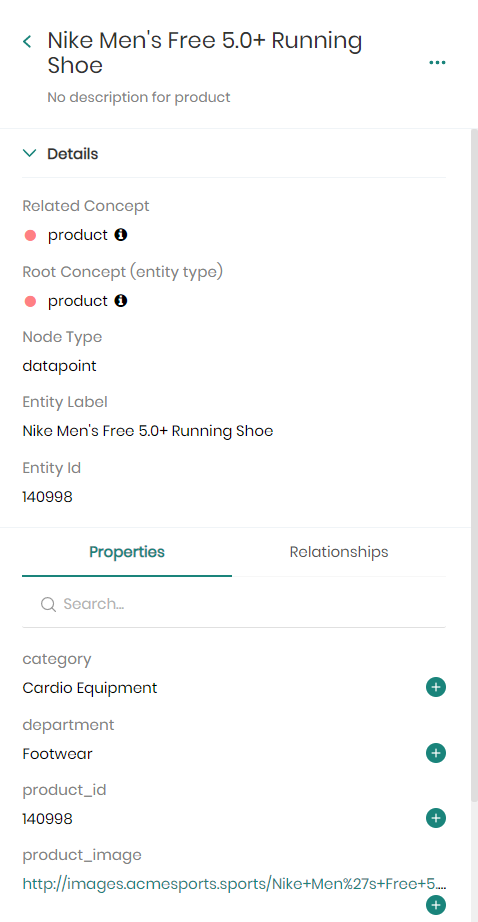
A right-side panel that opens when you click on a node in the graph. Provides additional information about a node (datapoint), enabling you to add any of its properties or relationships to the graph.
Node Action Menu
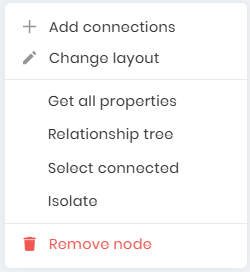
A list of actions that can be performed on a single node. This can be accessed by right-clicking on a node in the graph. The actions include:
Add connections - Allows to add connected relationships and properties to the selected node.
Change layout - The ability to change or edit the selected node’s label name, color and node background color.
Get all properties - Adds all the properties to the selected data point if they haven’t already been added using the query builder earlier.
Relationship tree - Opens a tree view of the edges (relationships) of the selected node in the node properties side panel on the right.
Select connected - Highlights all the connected nodes of the selected node.
Isolate - Allows isolating a single node or all its connected nodes leaving only them on the graph.
Remove node - Removes the selected node or all its connected nodes on the graph.
Query Action Log

A log of actions performed during the exploration. It can be accessed on the bottom side of the screen.
The log enables users to see the timestamp, status, action name and runtime of each action performed on the graph. In addition, when hovering over the actions in the log the following options appear:
Copy query - The ability to view and copy any query behind any action performed on the graph.
Download JSON log - Downloads the chosen action as a JSON file.
Delete log - Deletes any action from the action log.