SQL Editor
The SQL Editor is a feature-rich environment for querying Timbr’s ontology-based semantic layer using SQL.
Users query the virtual knowledge graph instead of raw tables, leveraging relationships, business logic, and metadata to simplify complex queries. The editor enables filtering results, exploring concept metadata, and expanding relationships to generate reusable query paths without writing complex JOIN logic.
Every operation in the platform can also be performed directly through SQL, including managing ontologies, users, permissions, concepts, mappings, views, and cache jobs.
Users can also query the graph by using the Timbr REST API or using Apache Spark, R, Python, Scala, and Java.
Feature Overview
- Connects to just about any database backend
- A multi-tab environment to work on multiple queries at a time
- A smooth flow to visualize your query results using Timbr's rich visualization capabilities
- Browse database metadata: tables, columns, indexes, partitions
- Support for long-running queries
- A search engine to find queries executed in the past
- Supports templating using the Jinja templating language which allows for using macros in your SQL code
In the SQL Editor
The SQL editor is used to run SQL queries and it can be found within the SQL Lab menu item and contains the following components:
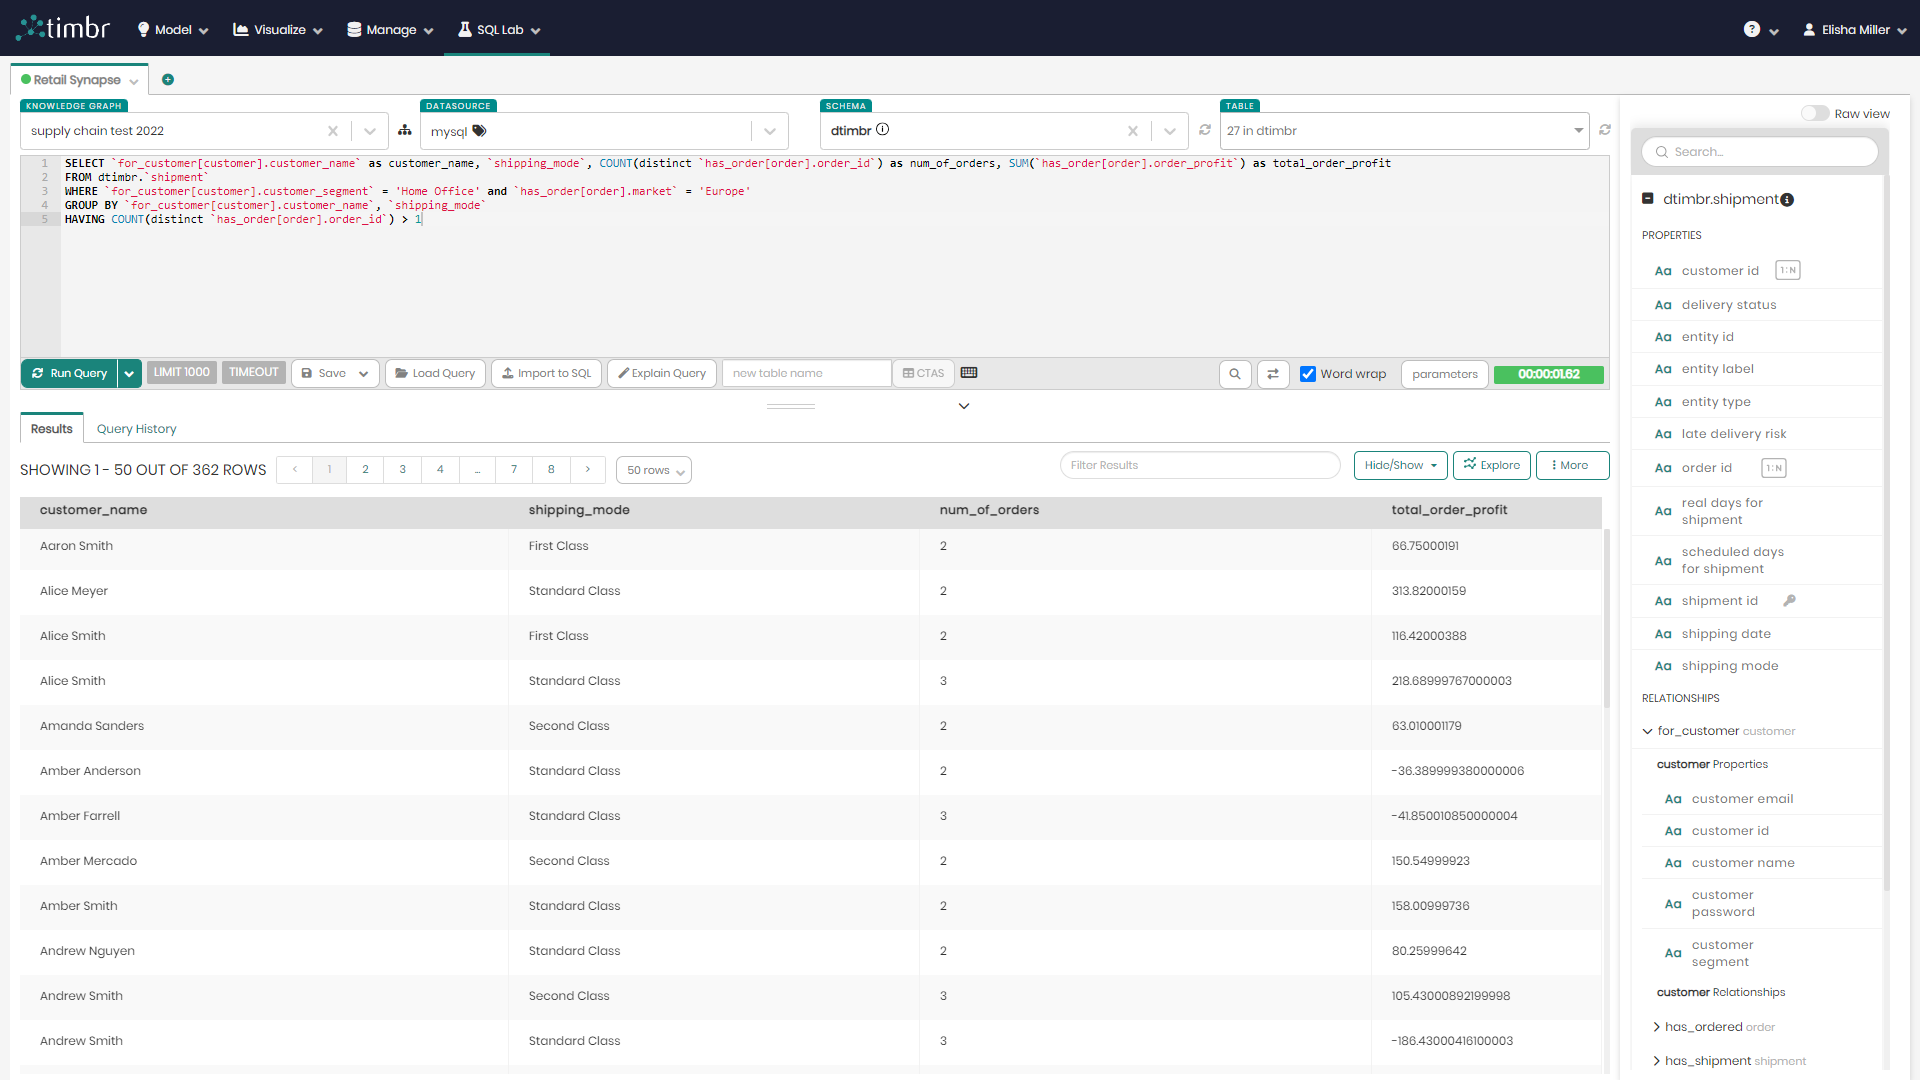
Upper Query Pane
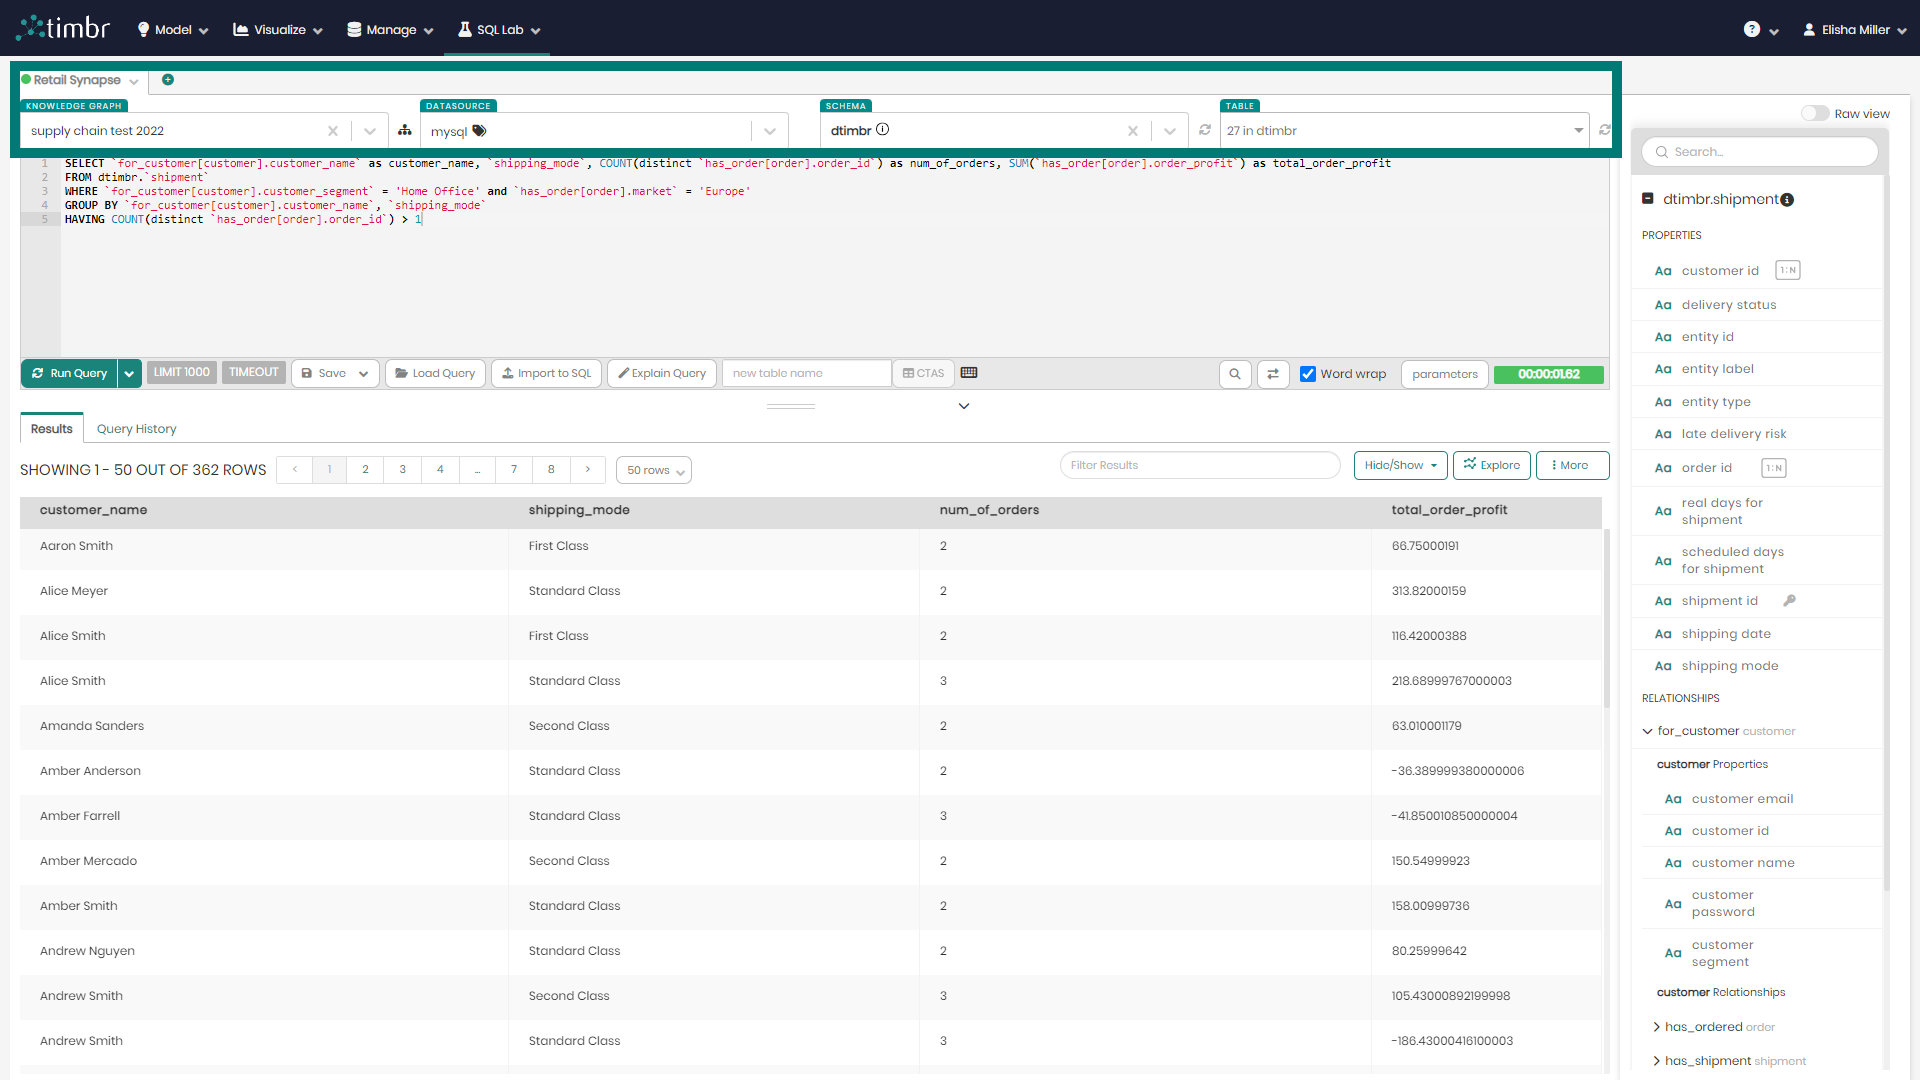
The upper query pane above the main query box is the starting point in the SQL editor. The upper pane contains two elements:
- Query tabs - Choosing either to create a query in the default tab that opens when entering the SQL editor or instead opening a new tab which can be done by clicking on the green plus symbol to the right of the tabs.
- Data source selection - Selecting the knowledge graph and datasource we’d like to query which is mandatory. The schema and table are optional and can be chosen to reveal the table columns and concept properties that will be revealed in the schema panel on the right side.
Additional features that can be found in the upper query pane are:
- Show selected ontology - To the right of the chosen knowledge graph, there is a symbol of a hierarchy which when clicked on opens a small pop-up presenting the entire selected ontology model.
- Force refresh - To the right of the chosen schema and table are the force refresh buttons, which can be used to refresh the schemas and tables if perhaps any changes have been made to them.
Main Query Box
The main query box is the space where users create, edit, and run their semantically enabled SQL queries.
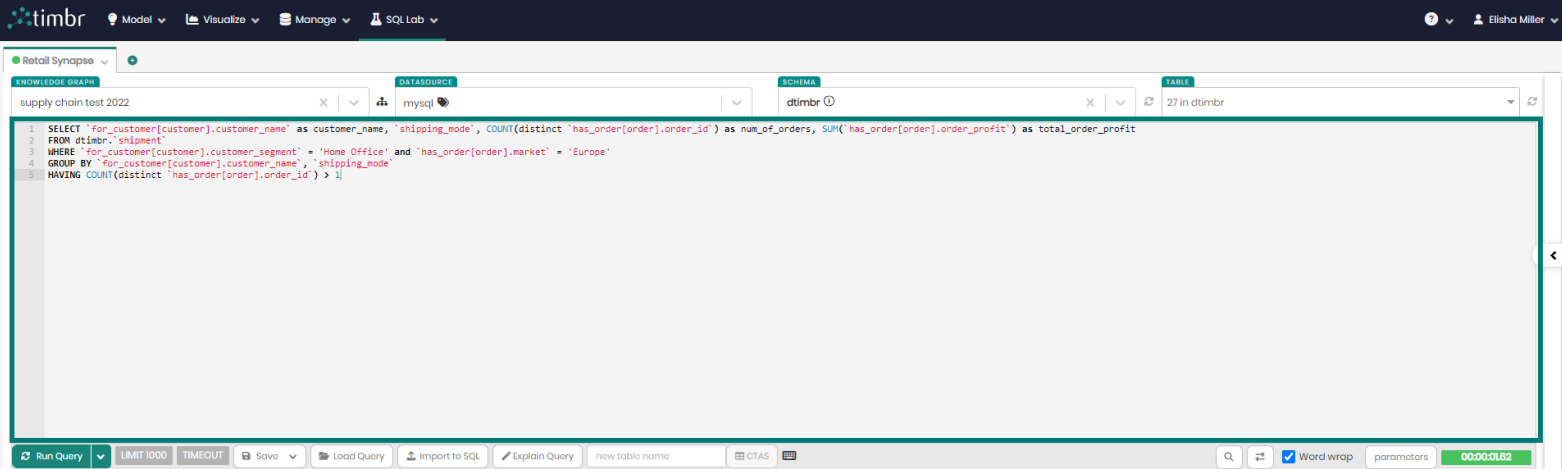
Query Toolbar
![]()
The query toolbar can be found directly under the main query box. The toolbar includes the following features:
Run Query - Runs the query in the main query box. The run query button contains a downwards pointing arrow which enables users to run the query and download the query results as a CSV file.
Limit - Choosing the row limit to be queried. The default is 1000 rows.
Timeout - Determining the query timeout in seconds. When left empty default timeout will be in effect.
Save - When clicked on, a dropdown opens with the 3 following options:
- Save query - Saves the current query which can later be found in the SQL lab tab under Saved Queries.
- Map to concept - Enables to map the query results to a chosen concept in the knowledge graph.
- Create view - This enables creating a view above the knowledge graph using the query results.
Load Query - This opens a window with all the saved queries, where any query or even multiple queries can then be loaded into the main query box in their own new tab.
Import to SQL - This enables uploading a CSV file and having Timbr convert the CSV file into an SQL query.
Explain Query - This opens an explain query window which presents the query that was pushed down behind the scenes of our current query to the datasource. This enables users to see what their query would look like without Timbr's relationships and business logic, where users would need to write up to 90% more code.
New table name - This enables typing a new table name and saving the query results to the new table being created.
Keyboard shortcuts and snippets - Presents various shortcuts and snippets in the SQL editor helping users write and run queries faster.
Search - This enables to locate specific text within the current SQL query.
Search and Replace - This expands upon the basic search by allowing you to not only find a term but also replace it with a new one throughout the SQL query.
Word wrap - When the word wrap checkbox is marked, word wrap will be activated and any text that exceeds the length of any specific row will be pushed down to the next row. When the word wrap checkbox is unmarked text on any row can continue until specified otherwise.
Parameters - This enables creating and editing templates using the Jinja templating language which allows for using macros in the SQL code.
Query timer - Shows the query run time once the run query button is clicked.
Schema Metadata Panel
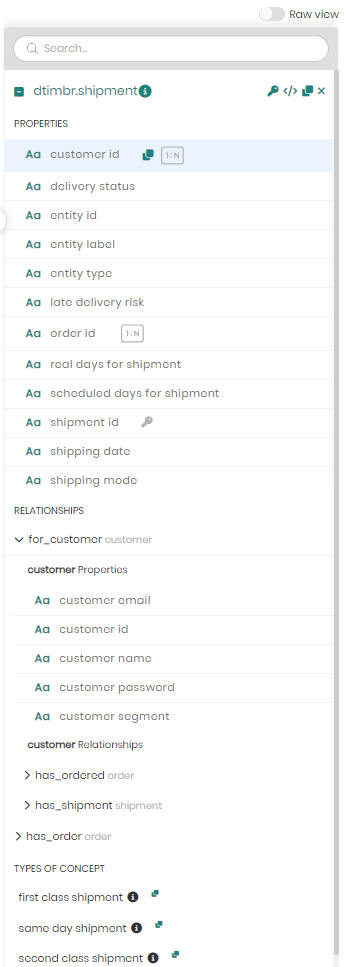
The schema metadata panel can be found on the right side of the main query box once a schema and table are selected. The panel presents the selected tables’ metadata containing their properties and relationships, enabling users to copy and paste the properties and relationships directly into the query.
When hovering over a table in the metadata, to the right of the schema and table name the following symbols will appear:
Keys and indexes - This enables users to view the different keys and indexes that exist in the current table.
Copy full table name - Enables users to copy the full schema and table name that can then be pasted into the main query box.
Copy statement - Copies the entire metadata containing all the properties and relationships to the clipboard as a SELECT statement, that can then be pasted into the main query box.
Remove table preview - When the X is clicked the current table selected will be removed from the metadata panel.
Query Results
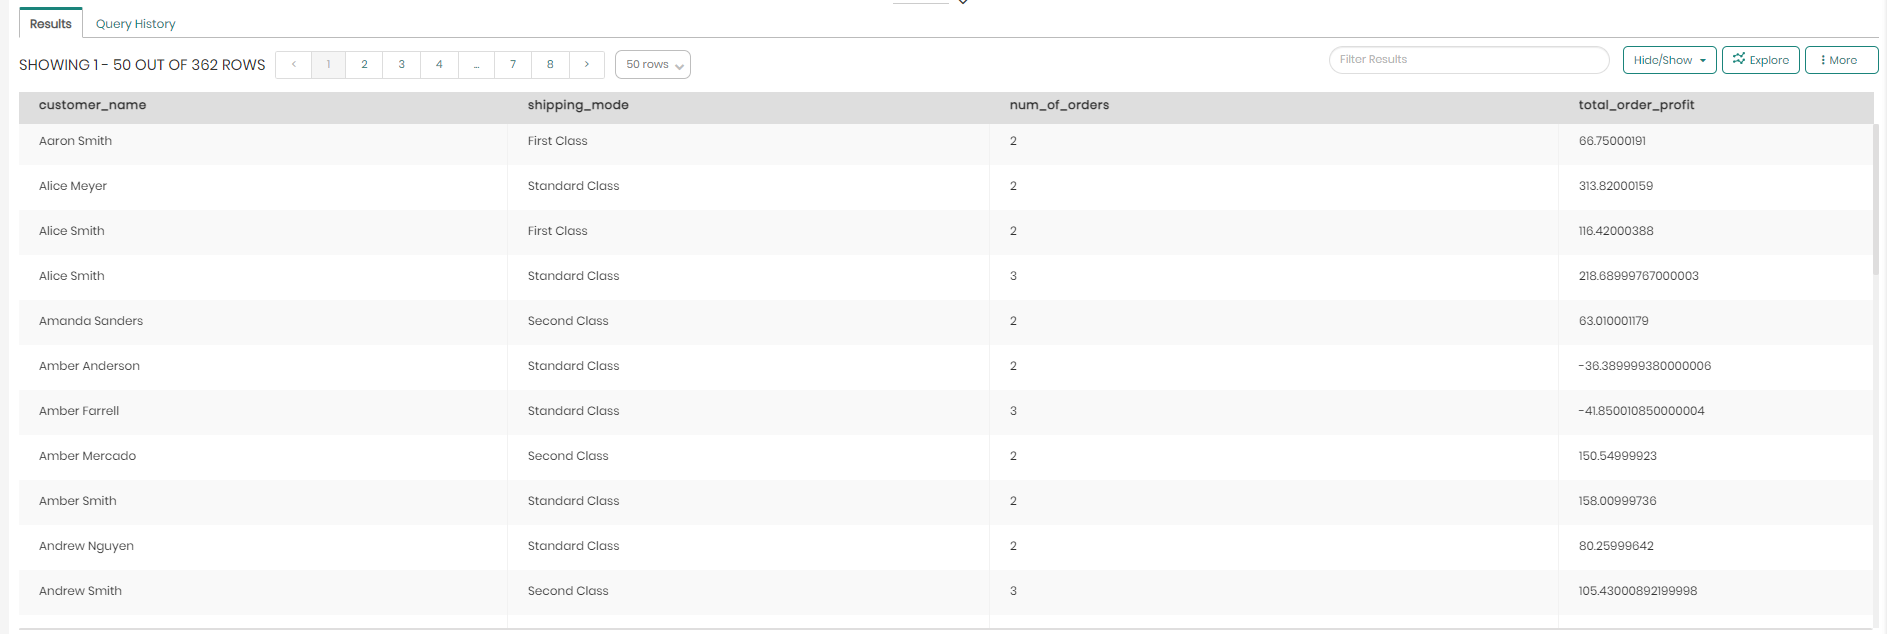
The query results can be seen on the bottom portion of the screen after a query has finished running. The query results section contains the following two main tabs:
Results
The results section presents the results of the query and offers additional features which can be found right above the results box on the upper right side which includes:
Filter Results - A search bar to type and filter for specific results.
Hide/Show - Choosing which result columns to hide and which to show.
Explore - Enables to transfer the query results to Timbr’s built-in BI module to explore and present the results using any of the various charts offered by Timbr.
More - The more button gives users additional options which include:
- Remove null columns - Removes all the null columns in the query results.
- Export result set - Exports the query results as either a CSV, JSON or TEXT file.
- Results Stats - Presents different stats of the query such as total rows, total columns, total cells, existing values, nulls, query limit, query runtime, query start, and end date.
- Clipboard - Copies the entire results to the clipboard to be used anywhere.
- Show column stats - Adds stats above the different columns such as unique values, null values, Min, Max, Avg, and more.
Query History
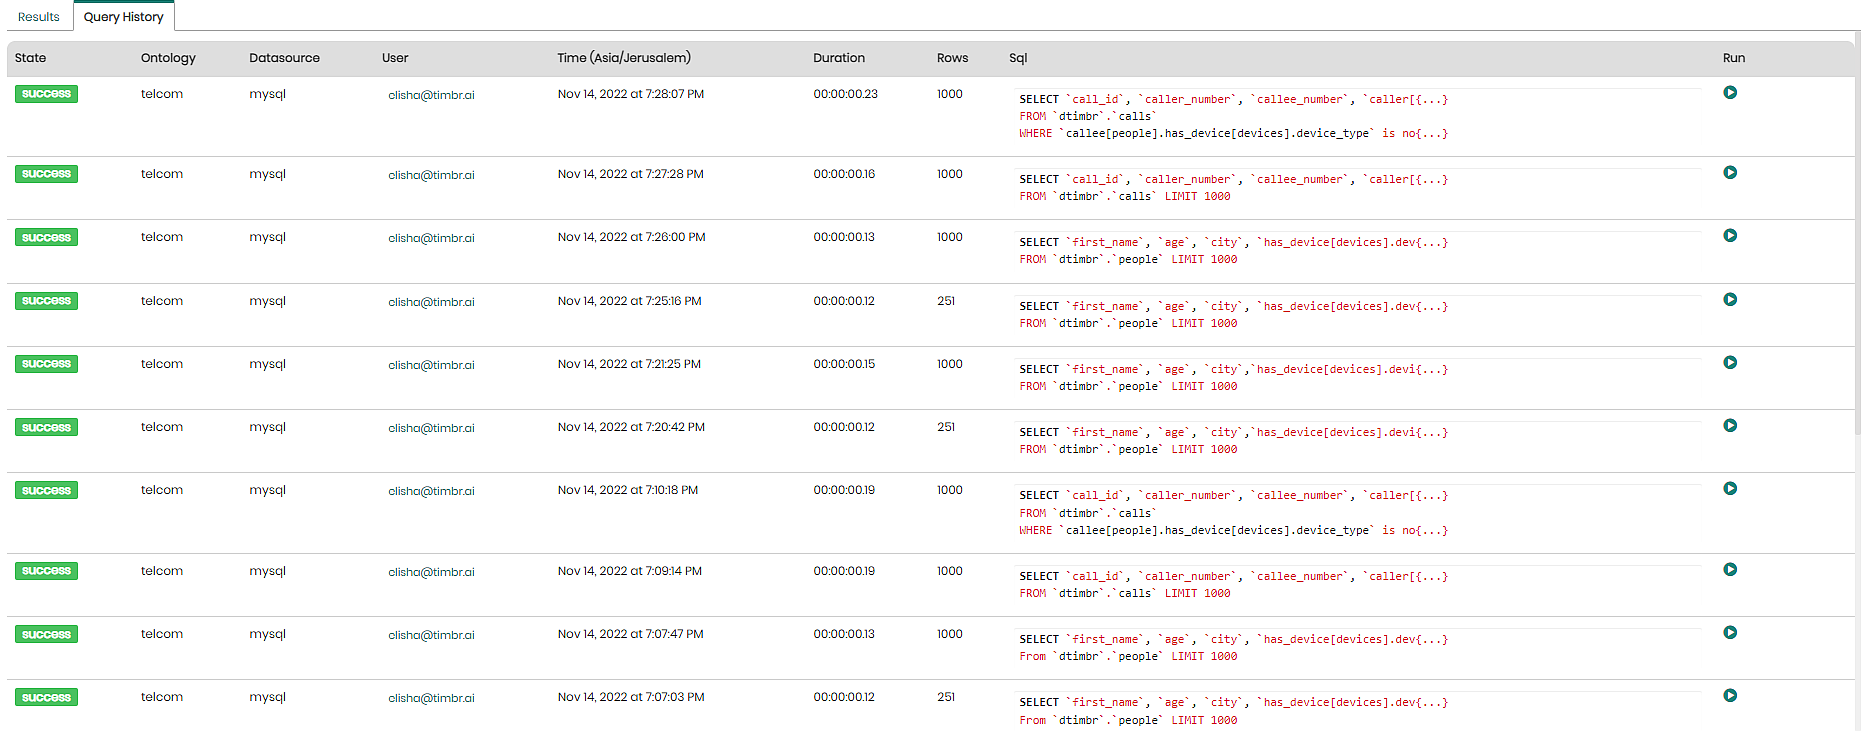
The query history tab presents the history of all queries that have been run in the past including additional information such as:
- State - Presents the state of each query, whether the query ran successfully or failed.
- Ontology - Presents the name of the Ontology that was used in each query.
- Datasource - Presents the Datasource that was used in each query.
- User - Presents the user behind each query.
- Time - States the exact time and date for each query at run time.
- Duration - States the amount of time it took to run each query.
- Rows - Shows the number of result rows that have been returned for each query.
- SQL - Shows a preview of each query and its SQL syntax. When clicked on, a popup window will appear presenting the entire selected query in cases where the query was too long to show in the preview.
- Run - When clicked on the selected query will start to run in the main query box.