BI Dashboards
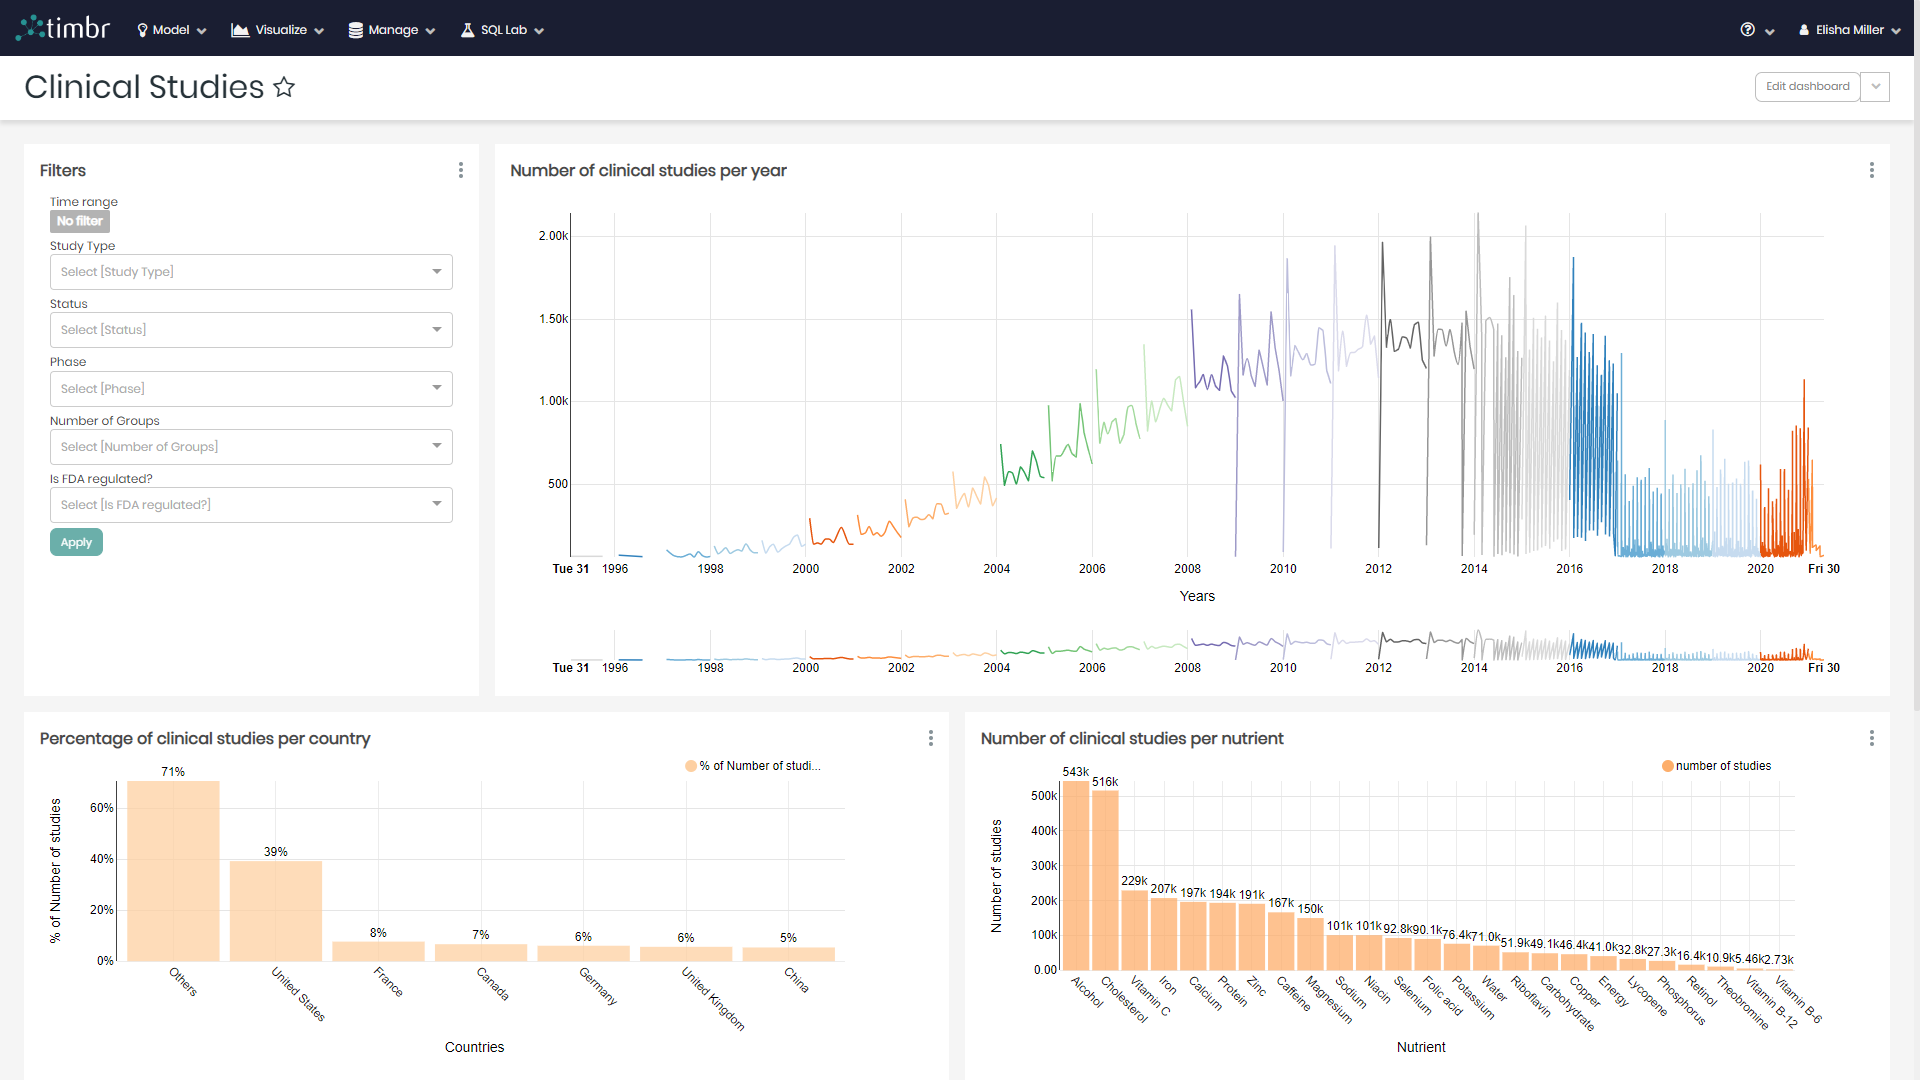
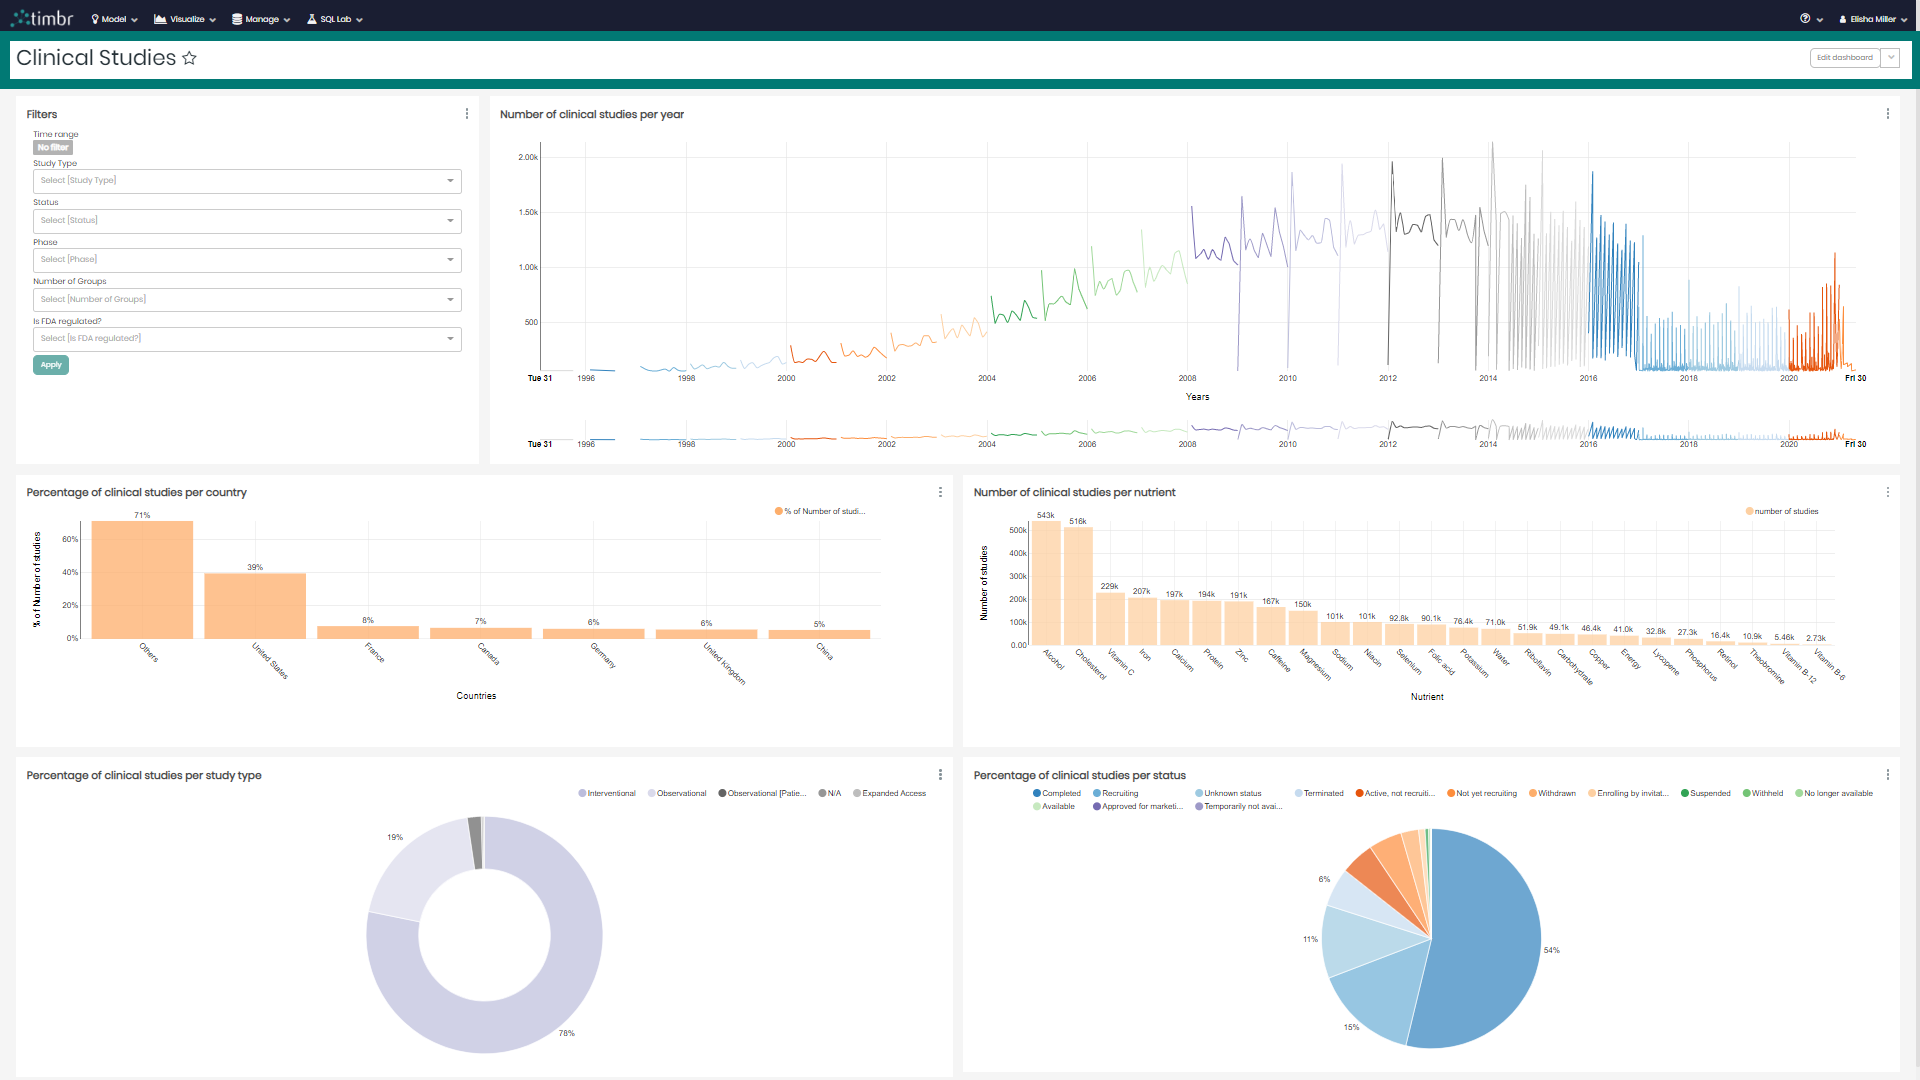
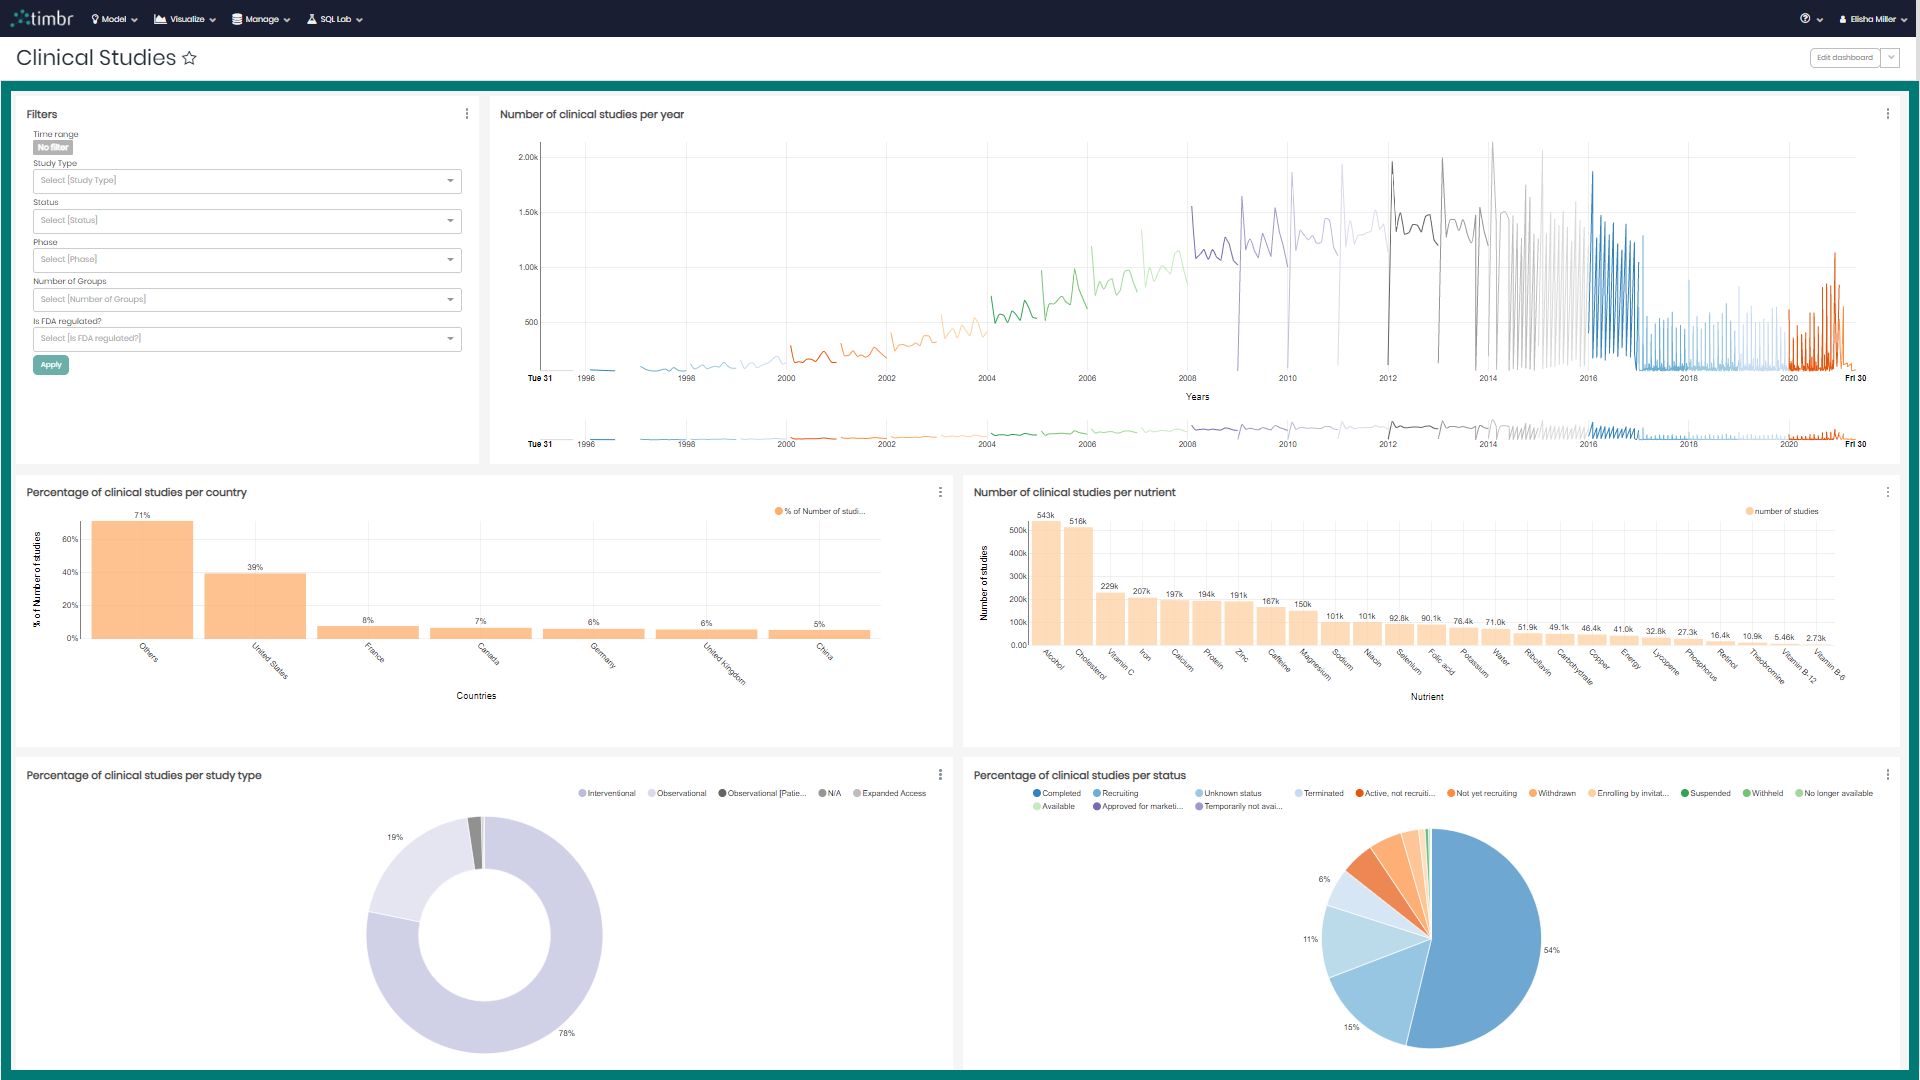
The dashboard component in Timbr enables users to create interactive dashboards and expose them to any user.
The dashboard can be defined with automated refresh intervals, designed with customized CSS templates, and can include multiple tabs, charts, and filters.

The dashboard component in charge of editing and presenting knowledge graph charts can be found in the visualize tab and contains the following components:
Top Menu

On the top left, users can see the name of the selected dashboard and can choose to add or remove the dashboard from the favorites by clicking on the star.
On the top right, is Edit dashboard that when clicked on offers the following editing options:
Your charts & filters - Enables users to add previously created charts and filters to the current dashboard.
Tabs - Allows users to add new tabs to the current dashboard.
Row - Allows users to add new rows to the current dashboard.
Column - Allows users to add new columns to the current dashboard.
Header - Allows users to add new headers to the current dashboard.
Markdown - Enables users to edit their dashboard using markdown syntax.
Divider - Allows users to add dividers to the current dashboard.
The stated options can be hidden by clicking on Hide components located on the top right.
All charts in the dashboard can be dragged, resized as desired, and even deleted by clicking on the small trash can on the top right of each individual chart.
To the left of hide components, users can find the Undo/Redo buttons in order to undo/redo any edits done on the dashboard.
To the right of hide components is Switch to view mode, which will close the editing components and return to the dashboard.
Connected to Switch to view mode is a downwards pointing arrow which when clicked on offers the following options:
Save as - Allows users to save the current dashboard.
Force refresh dashboard - Forces a refresh of the entire dashboard in case there have been any changes to the data reflected in the dashboard charts.
Set auto-refresh interval - Enables users to set an automated refresh to the dashboard after a specified time frame.
Edit dashboard metadata - Enables users to edit the metadata behind the dashboard. This includes changes to the dashboard name, owners, JSON, CSS and more.
Share dashboard - Generates a shareable URL that can be sent to colleagues via a link or by Email in order to share the current dashboard.
Edit CSS - Enables users to edit and style the dashboard using CSS and CSS templates.
Once finished editing and clicking on Switch to view mode, users will find another downward pointing arrow next to Edit dashboard that when clicked on offers some of the same options:
Save as - Allows users to save the current dashboard.
Force refresh dashboard - Forces a refresh of the entire dashboard in case there have been any changes to the data reflected in the dashboard charts.
Set auto-refresh interval - Enables users to set an automated refresh to the dashboard after a specified time frame.
Share dashboard - Generates a shareable URL that can be sent to colleagues via a link or by Email in order to share the current dashboard.
Dashboard Charts

The bulk of the dashboard component space is dedicated to the dashboard charts that can be seen below the top menu. Users can scroll up and down to view all the charts in the dashboard as the dashboard expands.
Charts in the dashboard can be interacted with by hovering over the different charts as well as clicking on the charts.
In addition, each chart contains 3 vertical dots on the top right of the chart that when clicked on offer the following:
Force refresh - Forces a refresh on the specific chart selected, refreshing in case any of the chart’s underlying data has been altered.
Edit chart metadata - Enables users to edit the metadata behind the selected chart. This includes changes to the chart name, owners, JSON, CSS and more.
Export CSV - Enables users to export the data representing the selected chart into a CSV file.
Explore chart - When clicked on, the selected chart will open in Timbr’s built-in charts component in order for users to explore and edit the chart further if necessary.
Share chart - Generates a shareable URL that can be sent to colleagues via a link or by Email in order to share the selected chart.