Query Search
The Query Search component allows users to search and monitor queries executed on Timbr’s ontology-based semantic layer. Users can filter historical queries based on knowledge graphs, datasources, query text, status, timeframe, or users, as well as monitor running queries and investigate failures.
The Query Search can be accessed through the SQL Lab tab and contains the following components:
Query History
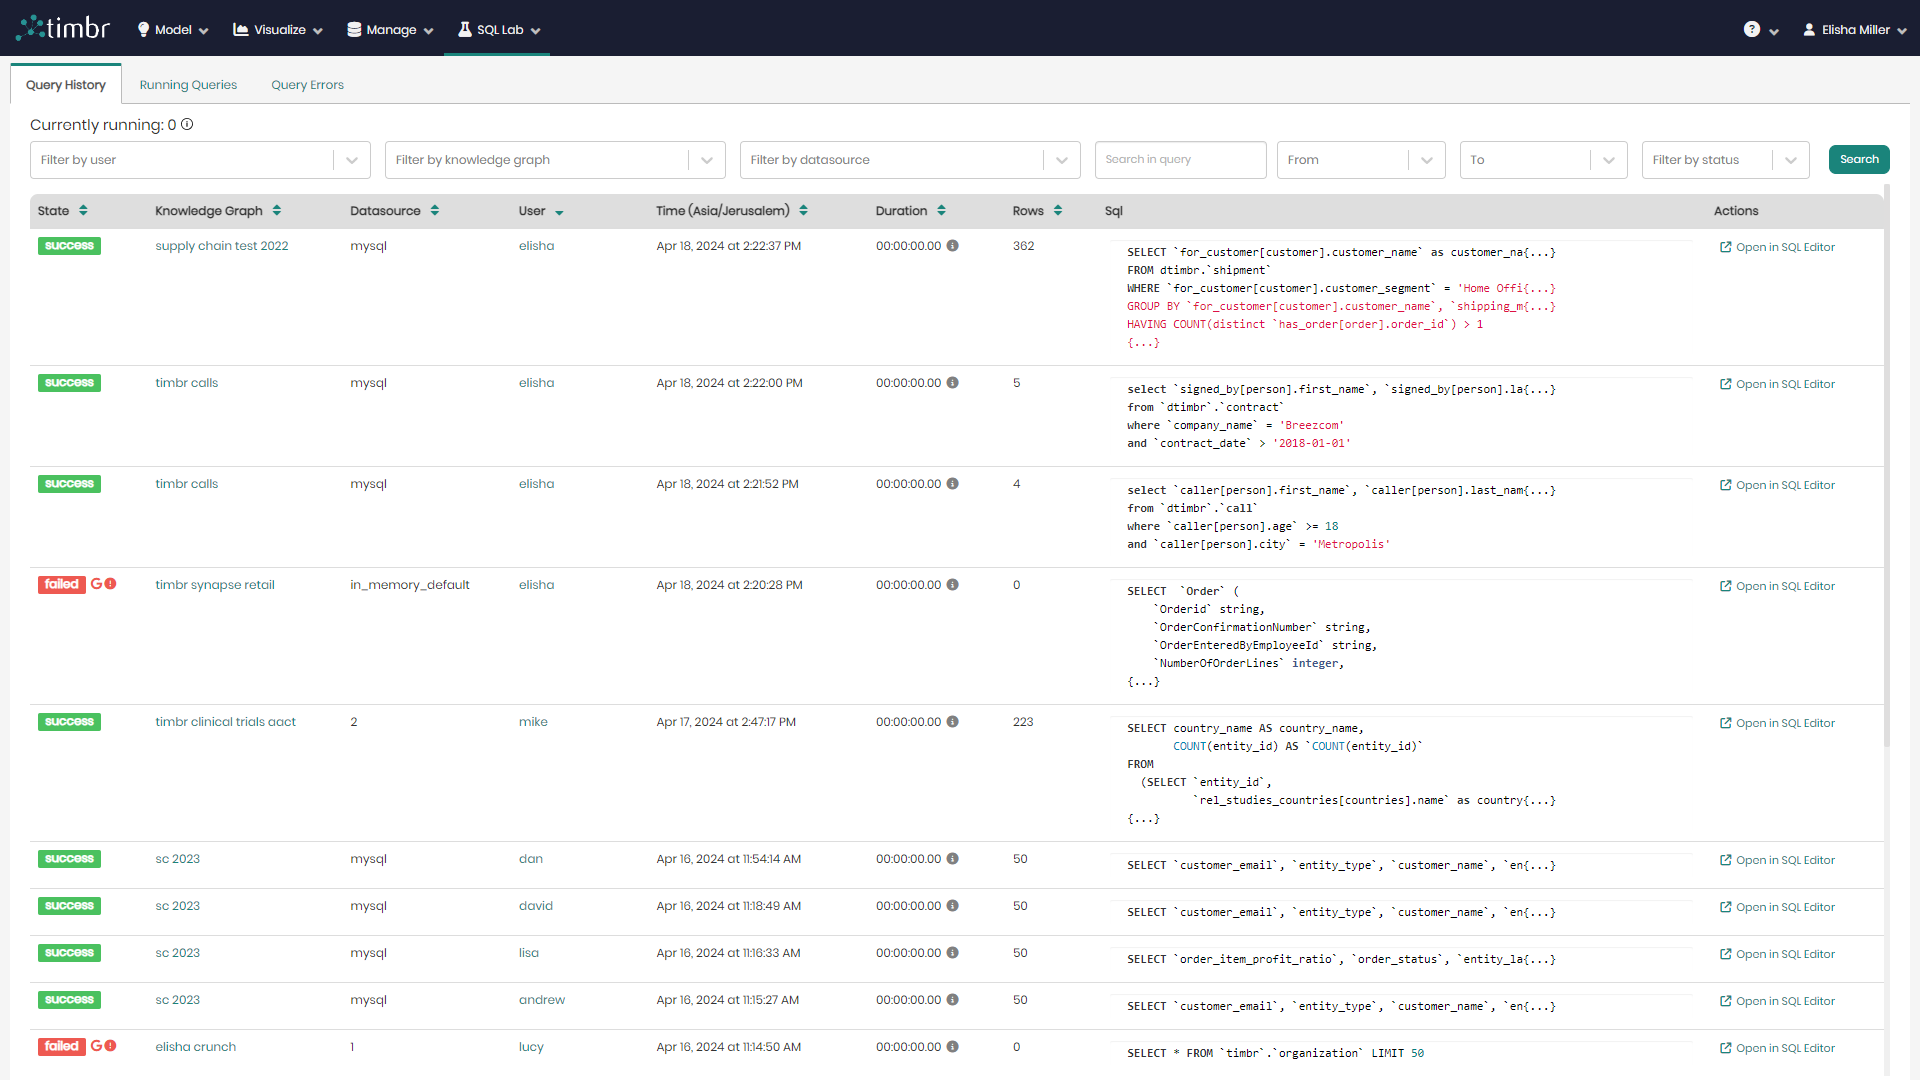
When entering the Query Search component there are three tabs. The default tab that appears is the Query History tab, which presents all the information about previously asked queries.
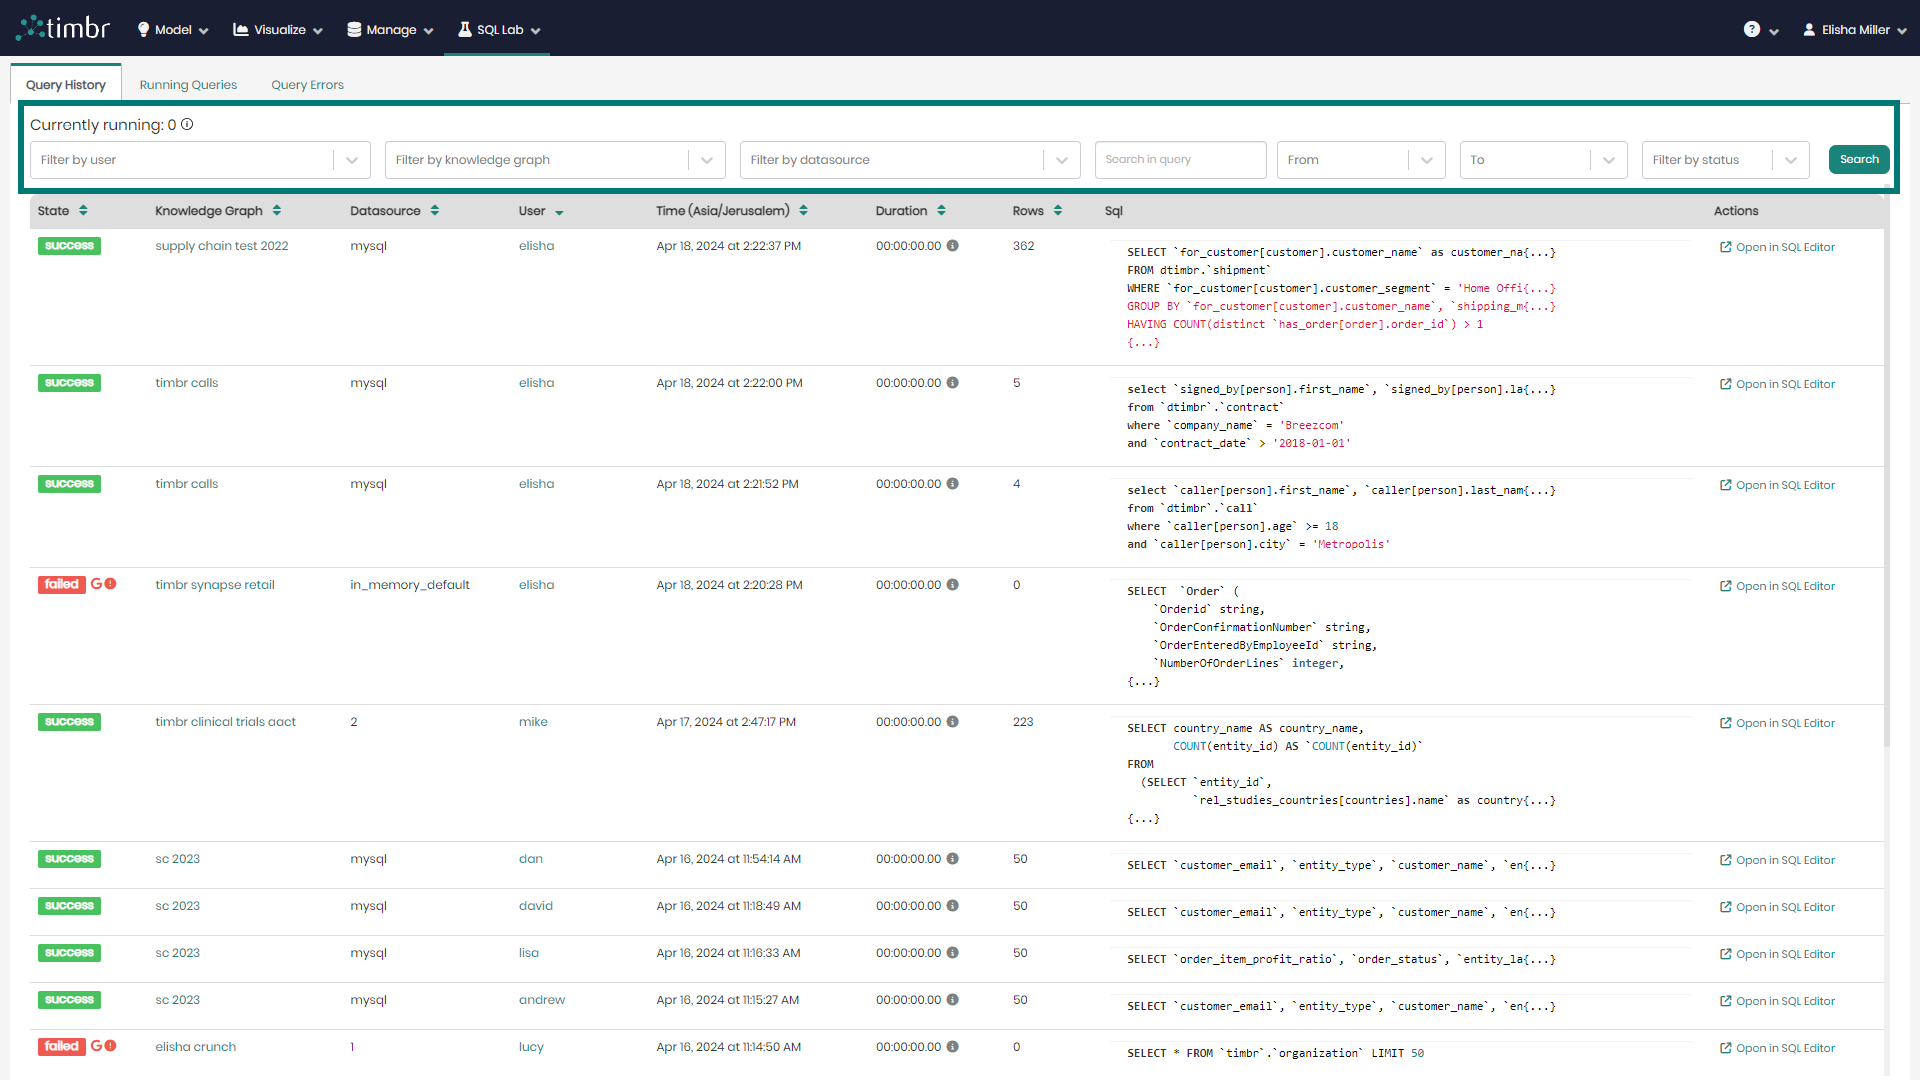
beneath the tabs is the upper query pane which contains the following options:
Currently running - Presents the number of queries that are currently running.
Filter by user - Enables to search through and filter the queries asked by specific users.
Filter by knowledge graph - Enables to search through and filter the queries asked on specific knowledge graphs.
Filter by datasource - Enables to search through and filter the queries asked using specific datasources.
search in query - Enables to search through and filter the queries based on specifically chosen text.
From & To - Enables to search through and filter the queries based on a specific time frame.
Filter by status - Enables to search through and filter the queries based on a specific query status. 
Search - Performs a search on the queries based on the parameters chosen in the various filters.
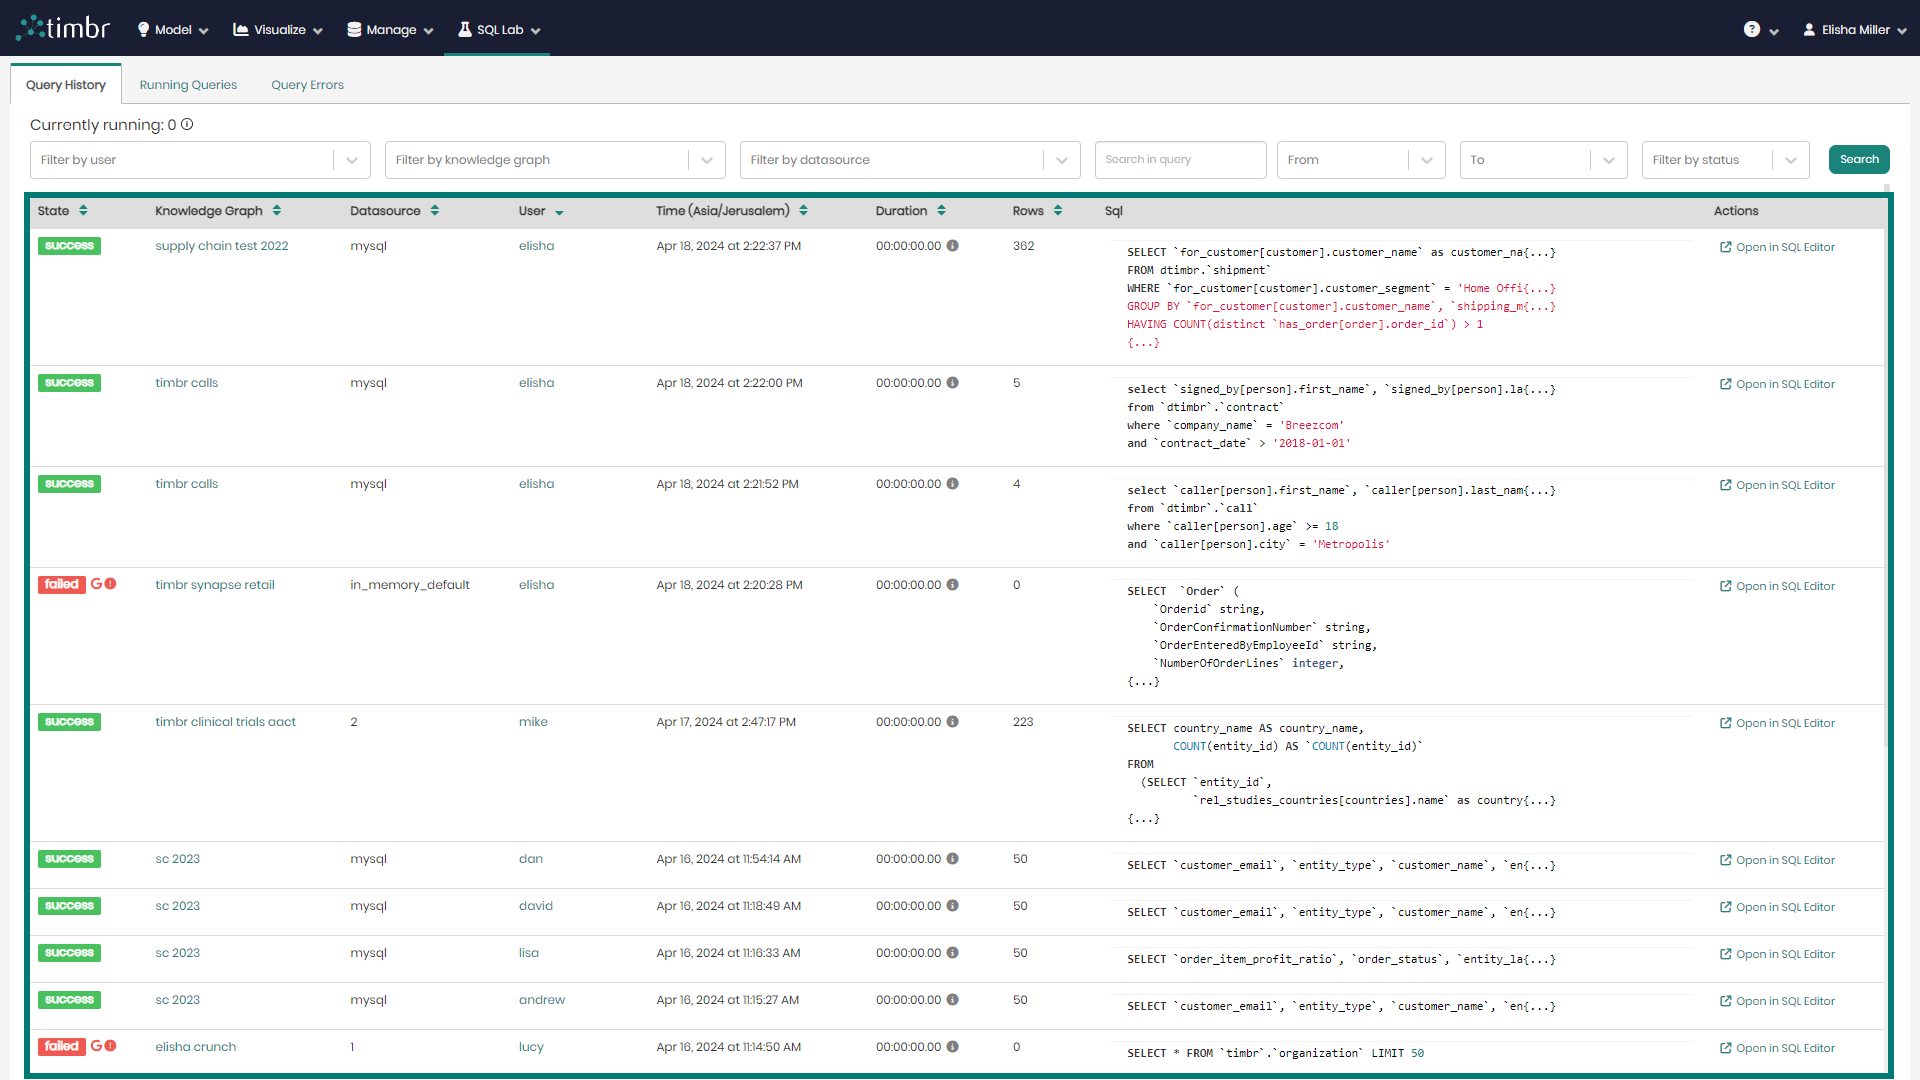
Beneath the upper query pane is the entire list of queries that were previously run. The list contains the following columns:
- State - Presents the state of each query, whether the query ran successfully or failed.
- Knowledge Graph - Presents the name of the Knowledge Graph that was used in each query.
- Datasource - Presents the Datasource that was used in each query.
- User - Presents the user behind each query.
- Time - States the exact time and date for each query at run time.
- Duration - States the amount of time it took to run each query.
- Rows - Shows the number of result rows that have been returned for each query.
- SQL - Shows a preview of each query and its SQL syntax. When clicked on, a popup window will appear presenting the entire selected query in cases where the query was too long to show in the preview.
- Actions - Contains a button called Open in SQL Editor that When clicked on will open the selected query in Timbr's SQL Editor.
Running Queries
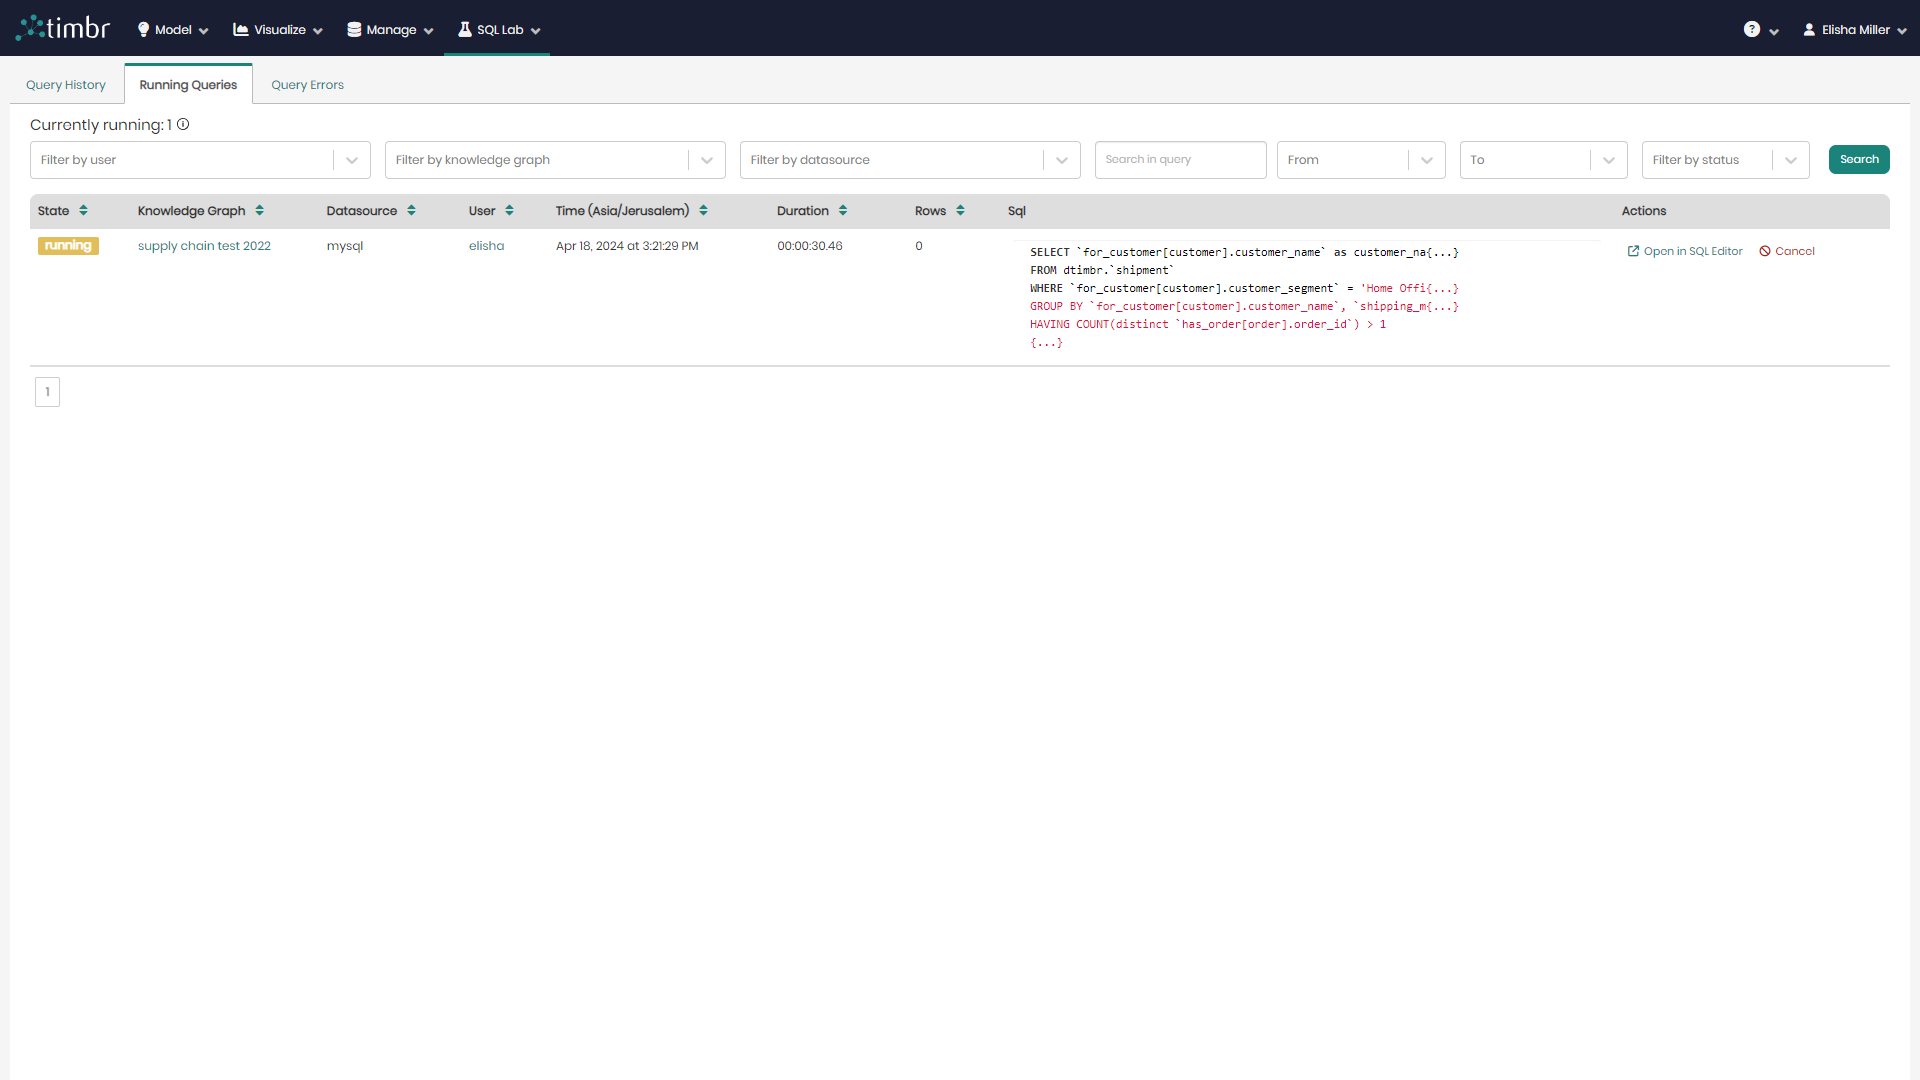
The second tab that appears in the Query Search component is the Running Queries tab, which presents all the information about currently running queries.
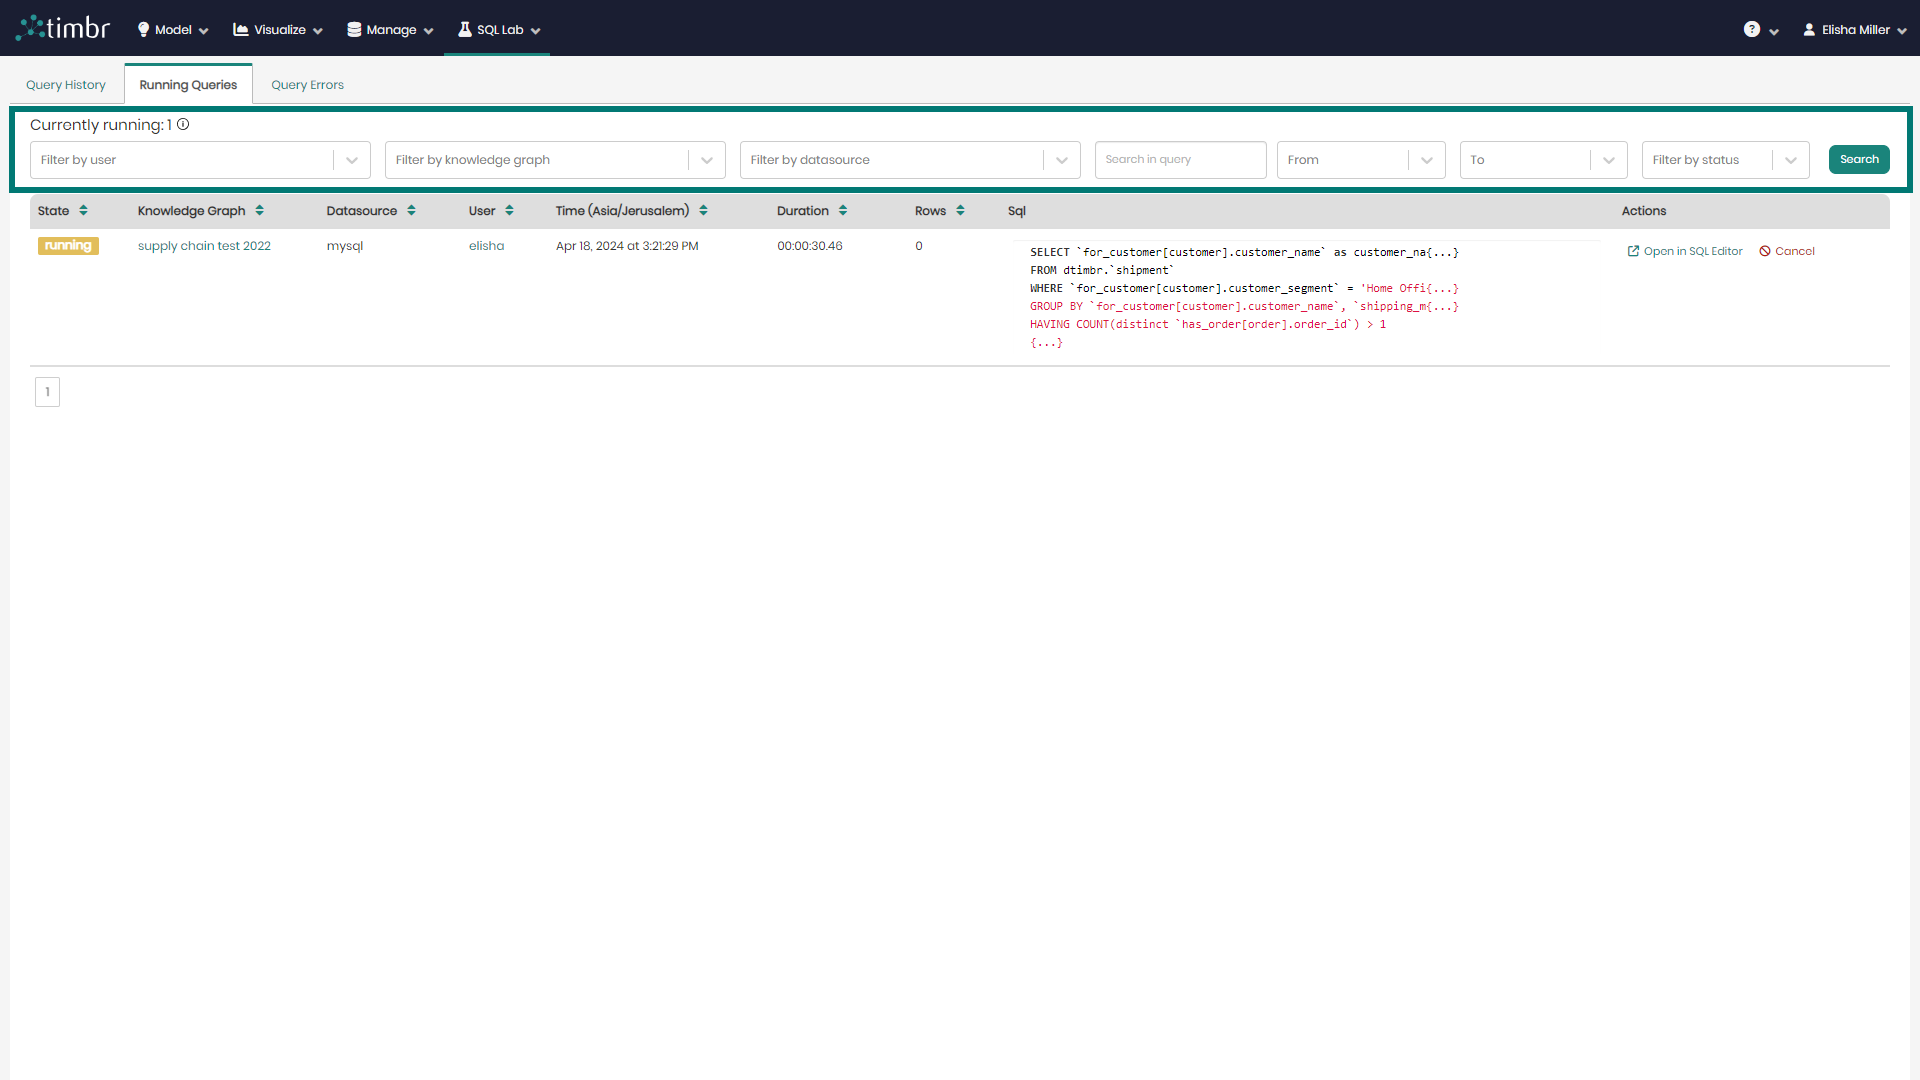
Similarly to the Query History tab, here too there's an upper query pane that contains the following options:
Currently running - Presents the number of queries that are currently running.
Filter by user - Enables searching through the currently running queries and filtering the queries asked by specific users.
Filter by knowledge graph - Enables to search through the currently running queries and filter the queries asked on specific knowledge graphs.
Filter by datasource - Enables to search through the currently running queries and filter the queries asked using specific datasources.
search in query - Enables to search through the currently running queries and filter the queries based on specifically chosen text.
From & To - Enables to search through the currently running queries and filter the queries based on a specific time frame.
Filter by status - Enables searching through the currently running queries and filtering the queries based on a specific query status.
Search - Performs a search on the currently running queries based on the parameters chosen in the various filters.
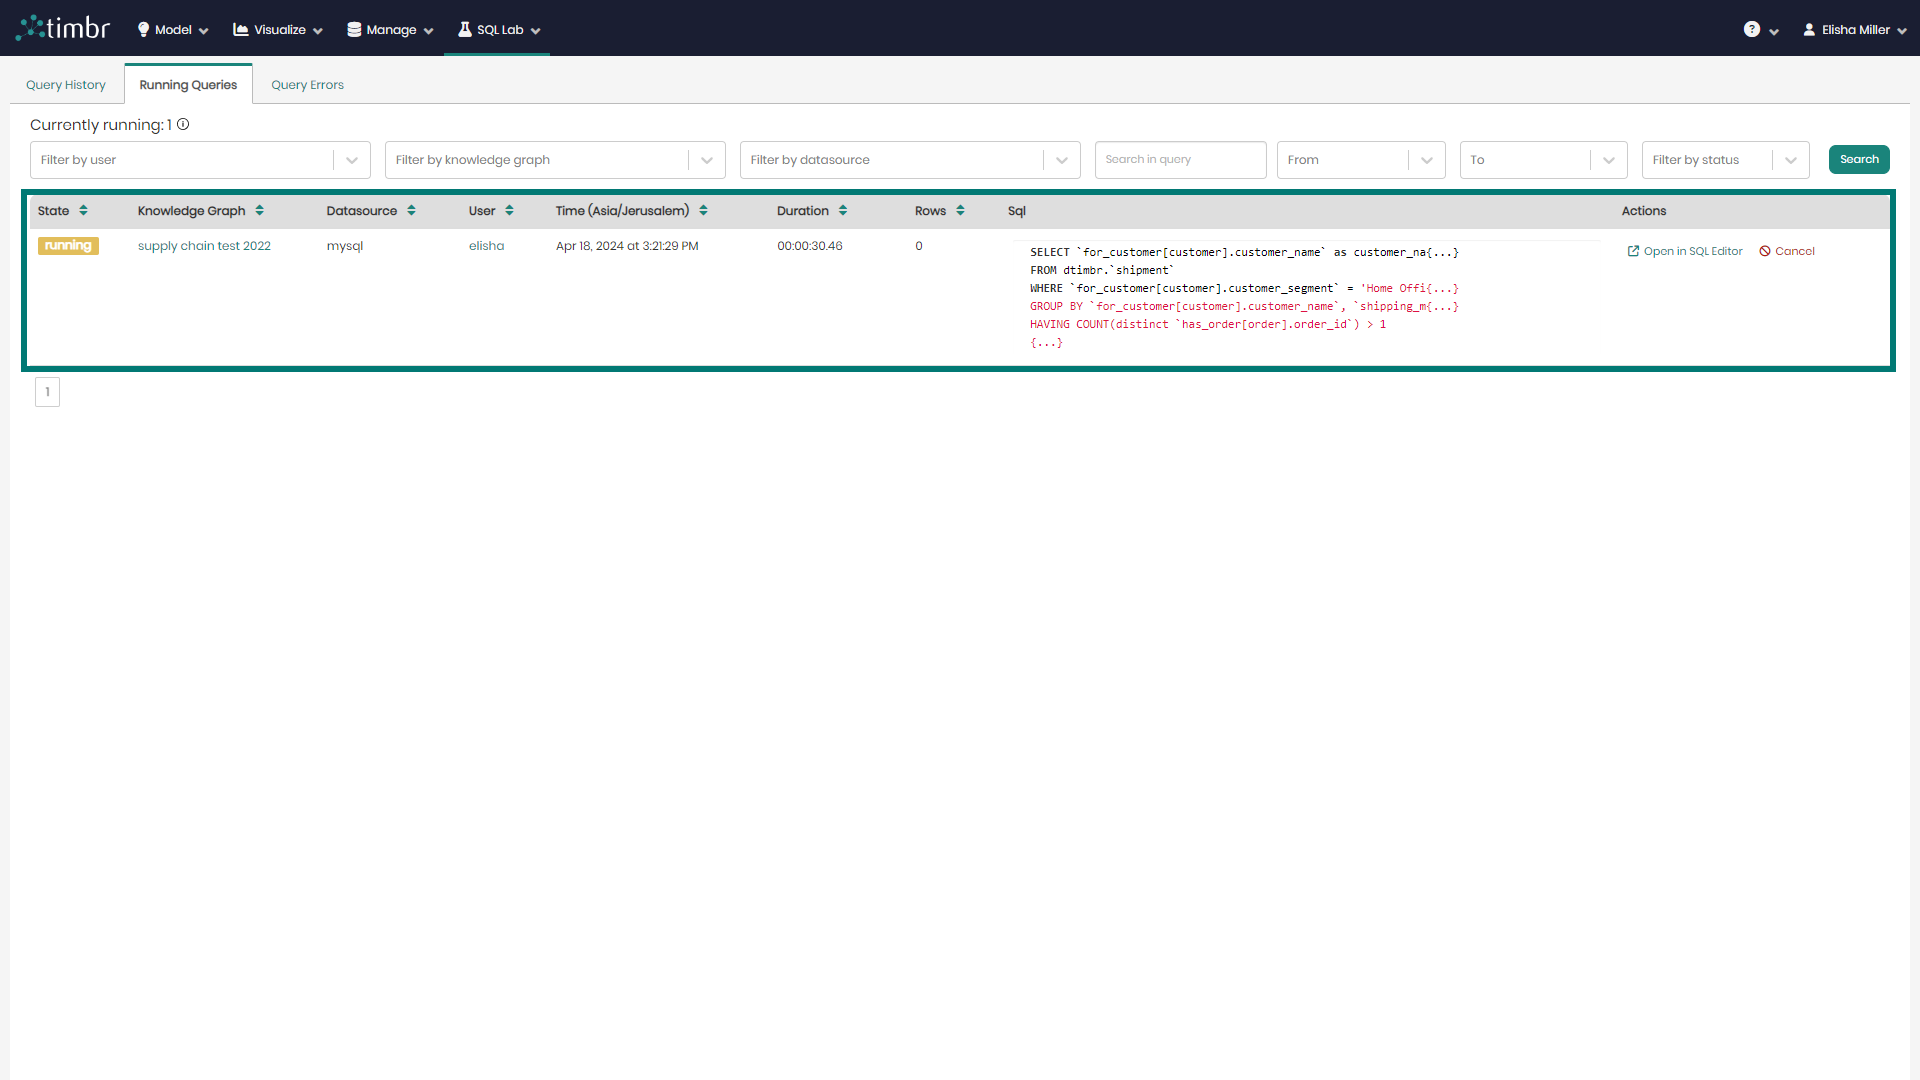
Beneath the upper query pane is the entire list of currently running queries. The list contains the following columns:
- State - Presents the state of each currently running query.
- Knowledge Graph - Presents the name of the Knowledge Graph that is being used in each query.
- Datasource - Presents the Datasource that is being used in each query.
- User - Presents the user behind each currently running query.
- Time - States the exact time and date for each query at run time.
- Duration - States the amount of time each query has been running for.
- Rows - Shows the number of result rows that have been returned for each query.
- SQL - Shows a preview of each query and its SQL syntax. When clicked on, a popup window will appear presenting the entire selected query in cases where the query was too long to show in the preview.
- Actions - Contains a button called Open in SQL Editor that when clicked on will open the selected query in Timbr's SQL Editor, as well as a Cancel button that when clicked on will cancel the currently running query selected.
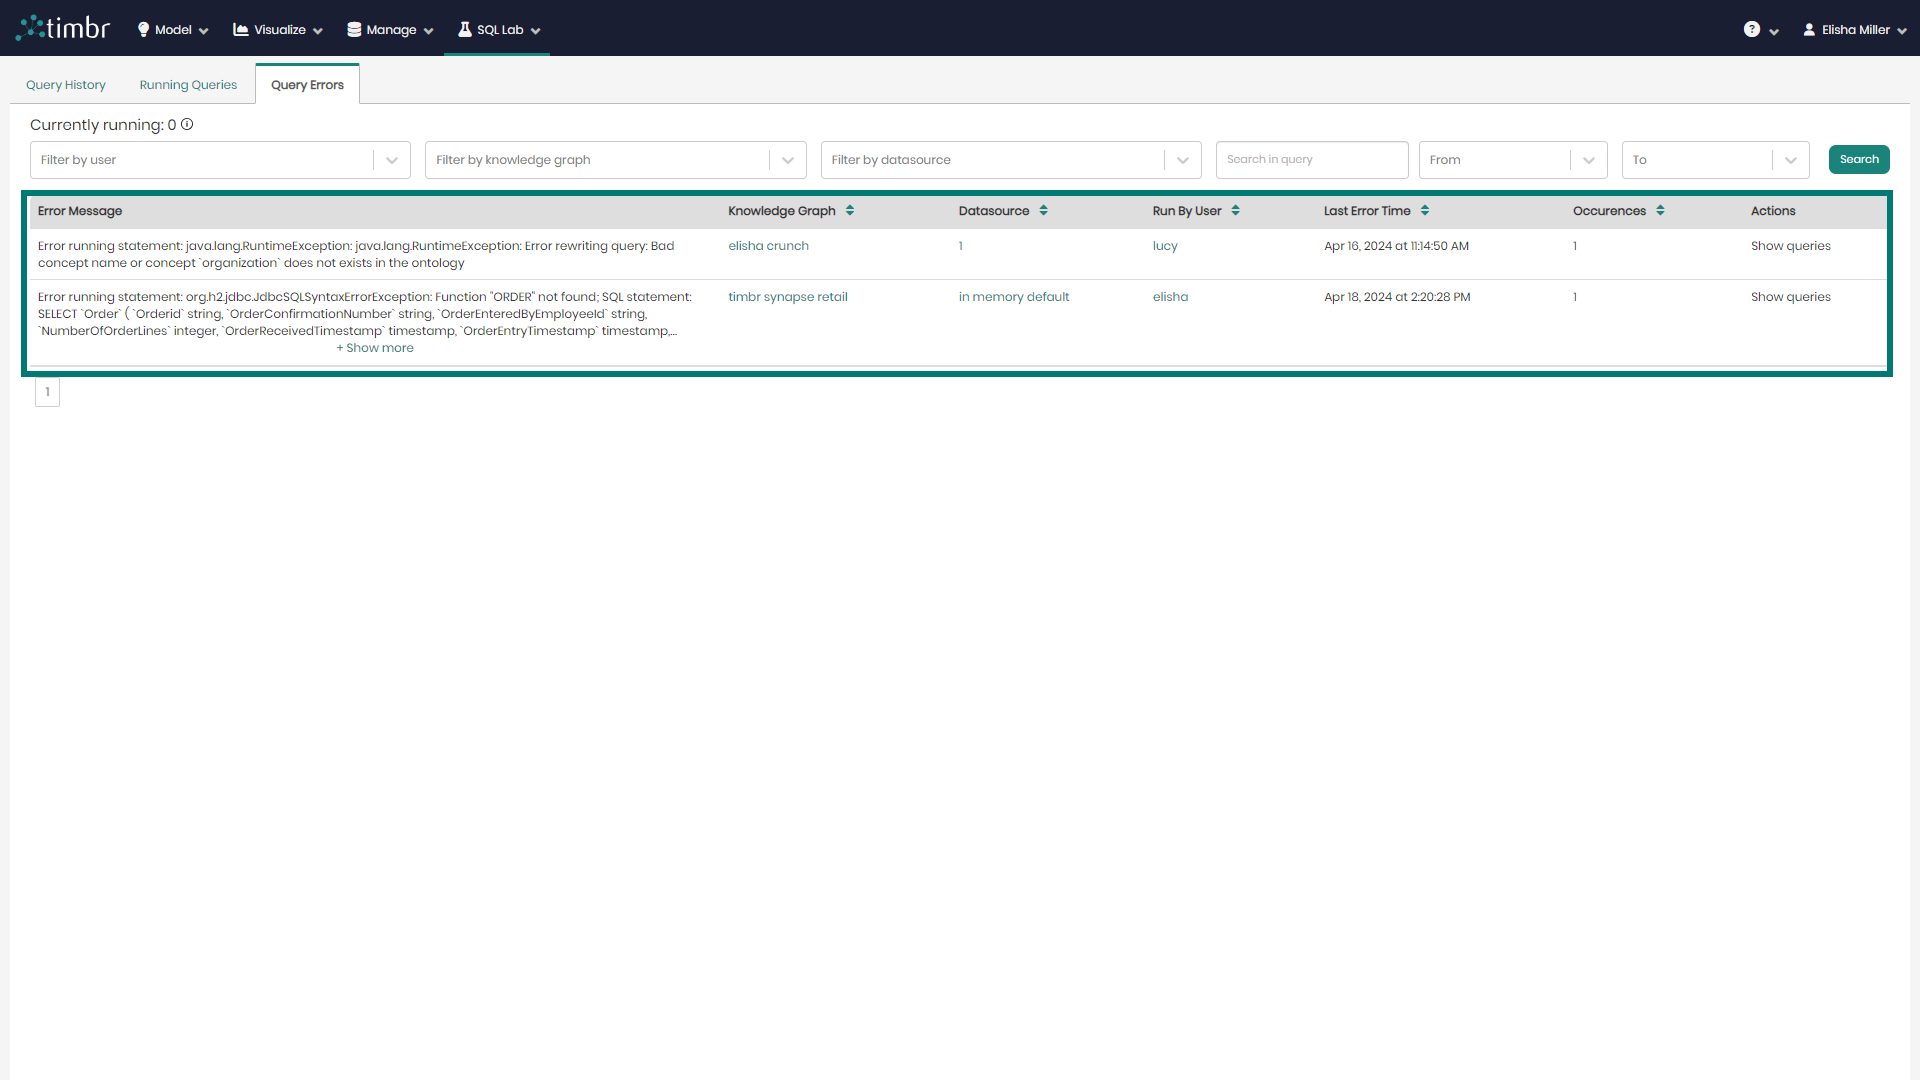
Query Errors
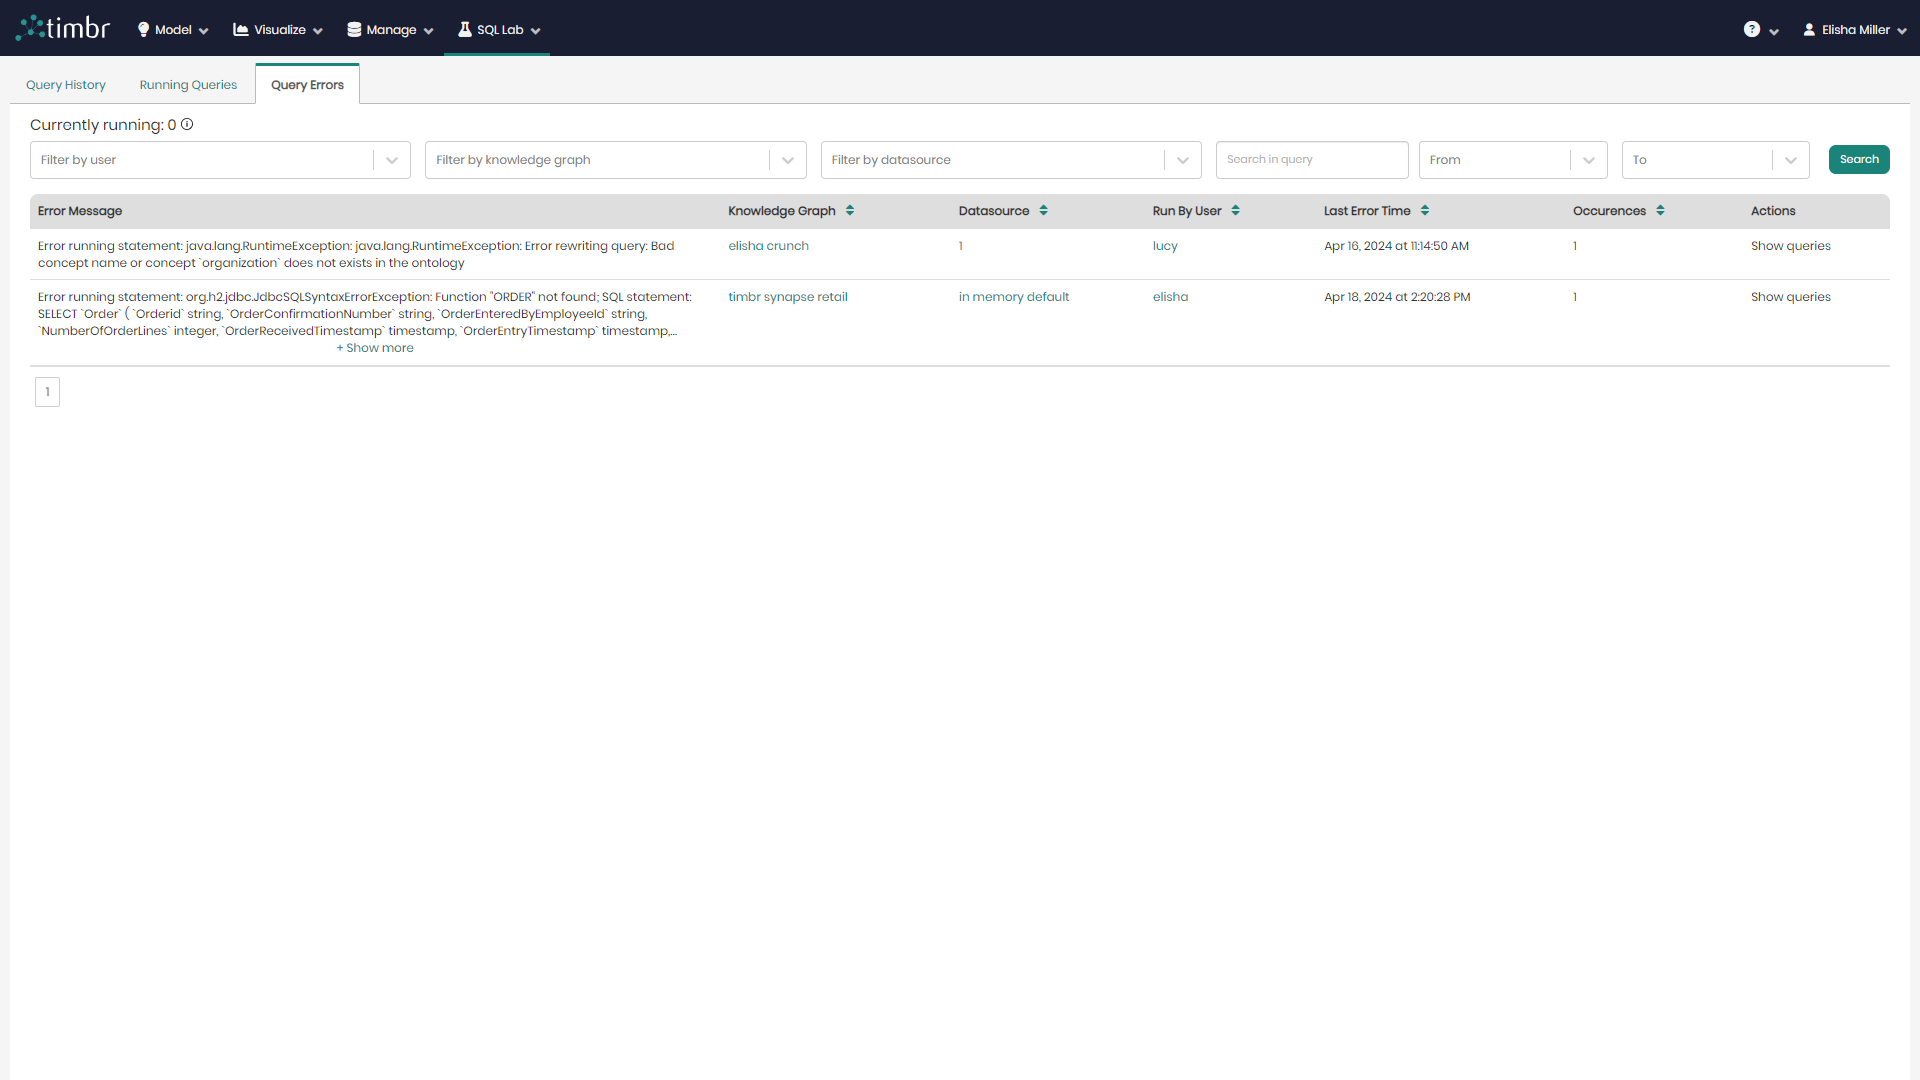
The third tab that appears in the Query Search component is the Querry Errors tab, which presents all the information on errors that occurred while running queries.
Similarly to the Query History and Running Queries tabs, here too there's an upper query pane that contains the following options:
Currently running - Presents the number of queries that are currently running.
Filter by user - Enables searching through the query errors and filtering the queries asked by specific users.
Filter by knowledge graph - Enables to search through the query errors and filter the queries asked on specific knowledge graphs.
Filter by datasource - Enables to search through the query errors and filter the queries asked using specific datasources.
search in query - Enables to search through the query errors and filter the queries based on specifically chosen text.
From & To - Enables to search through the query errors and filter the queries based on a specific time frame.
Search - Performs a search on the query errors based on the parameters chosen in the various filters.
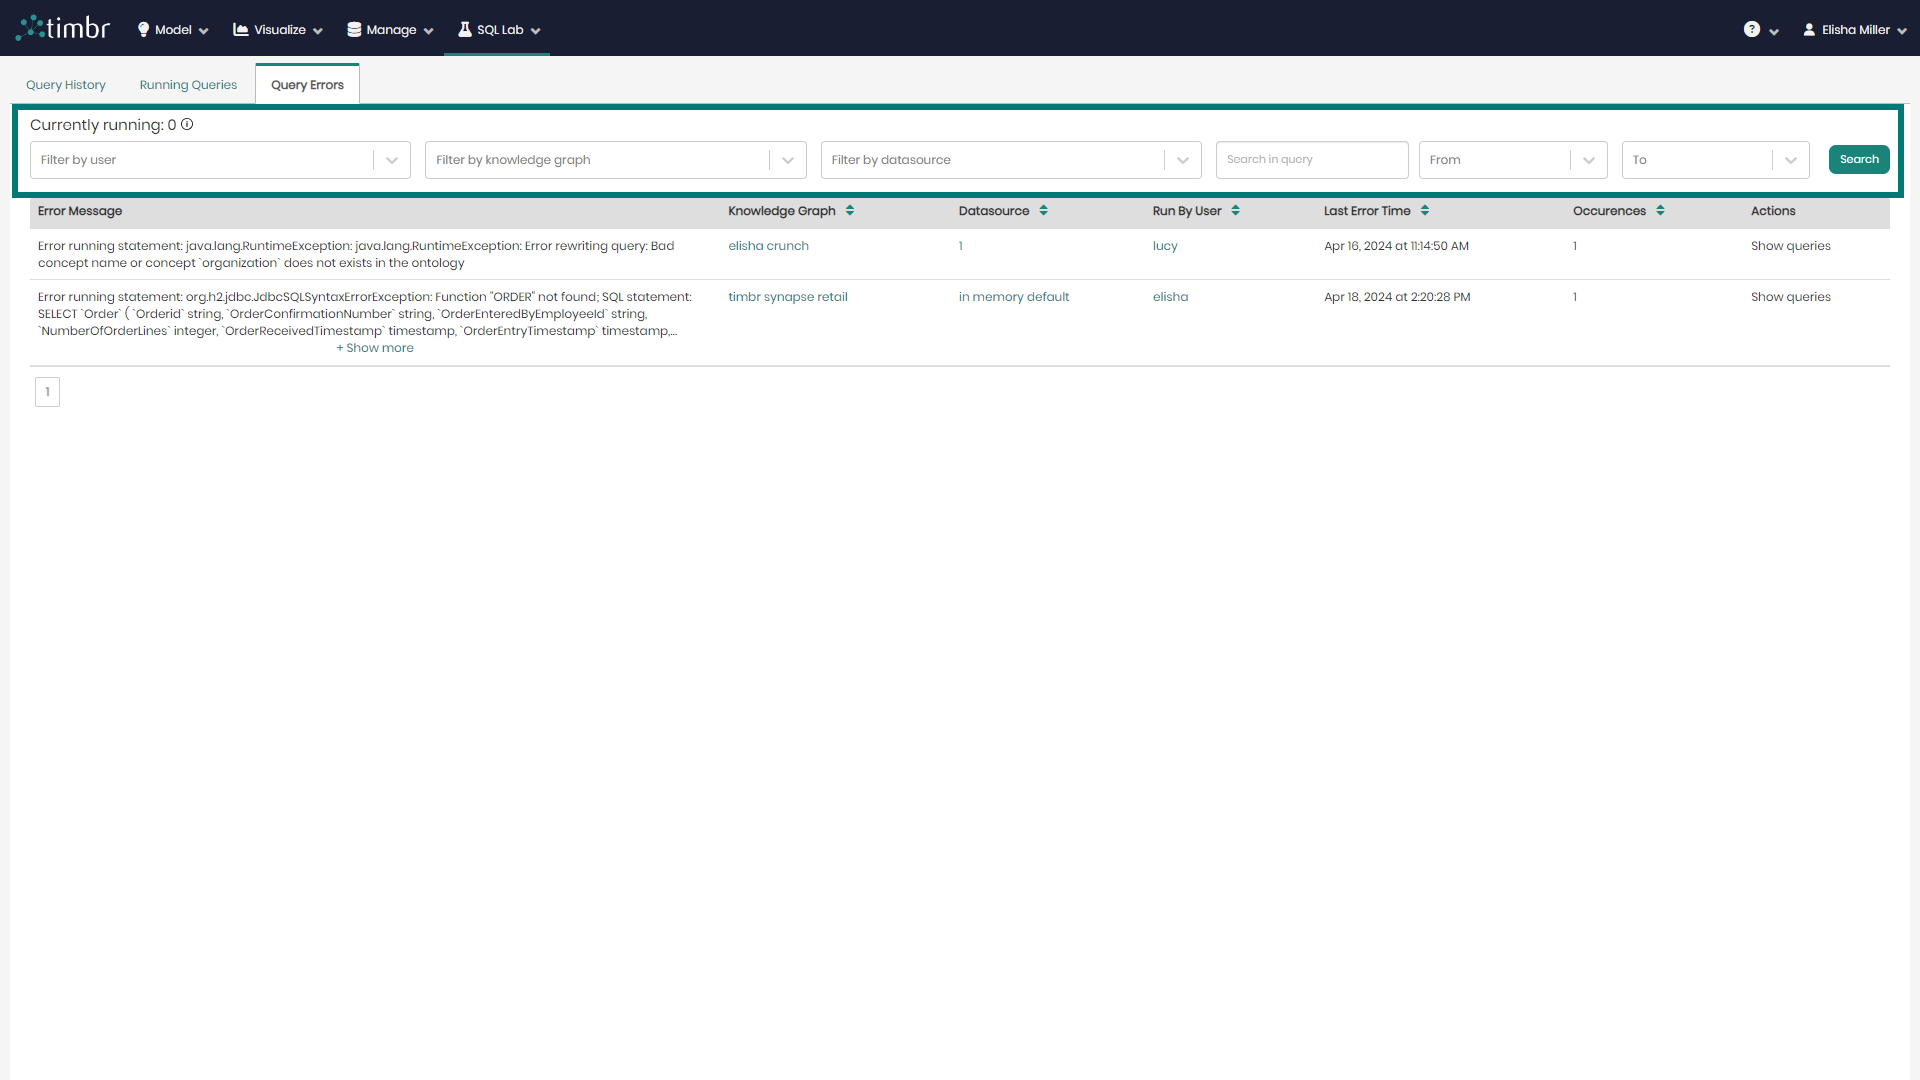
Beneath the upper query pane is the entire list of query errors. The list contains the following columns:
- Error Message - Presents the error message that was returned from the query.
- Knowledge Graph - Presents the name of the Knowledge Graph associated with the query error.
- Datasource - Presents the Datasource that was being used in the query that generated the error.
- Run by User - Presents the user who ran the query that returned the error.
- Last Error Time - States the exact time and date when each query error occurred.
- Occurences - States the number of times each query error occurred.
- Actions - Contains a button called Show queries that, when clicked, will open a window showing additional information on the query with the error, including the query syntax. It also provides the ability to click and open the query directly in Timbr's SQL Editor for further investigation and debugging.