Ontology Views
Ontology Views enable users to define reusable logic and metrics on top of Timbr’s ontology-based semantic layer.
They allow users to create and manage views and cubes that operate on the virtual knowledge graph, whether querying physical tables, building logic on concepts and relationships, or layering additional definitions on top of existing models. All logic is managed within a unified workspace that ensures consistency across the semantic layer.
- Views let you define reusable logic that queries tables, concepts, or other views.
- Cubes allow you to build structured metric models from concepts and their connected entities.
Both support:
- Granular access controls
- Caching for performance optimization
- Full data lineage and audit history
- Seamless integration with downstream tools

Timbr's Ontology Views component can be accessed through the Model tab by clicking on Ontology Views.
Getting Started
There are a few ways and reasons to create views and cubes in Timbr:
To create a view using the physical tables in the database.
This enables users to import existing views into Timbr for easier access, centralized control, and full lineage back to the source.To create views on top of knowledge graph concepts.
This allows you to define reusable logic using relationships and inherited properties between concepts in the knowledge graph.To create views above existing views.
This helps simplify complex queries by layering logic and organizing reusable definitions across domains.To create a cube based on a concept in the ontology.
This enables users to define and reuse business metrics by selecting properties and measures directly from a concept and its related entities.To create a cube from existing logic.
This makes it easy to bundle predefined measures and properties into structured outputs for BI tools or semantic exploration.
After selecting Ontology Views from the Model tab, choose the Knowledge Graph where you'd like to create or edit views and cubes.
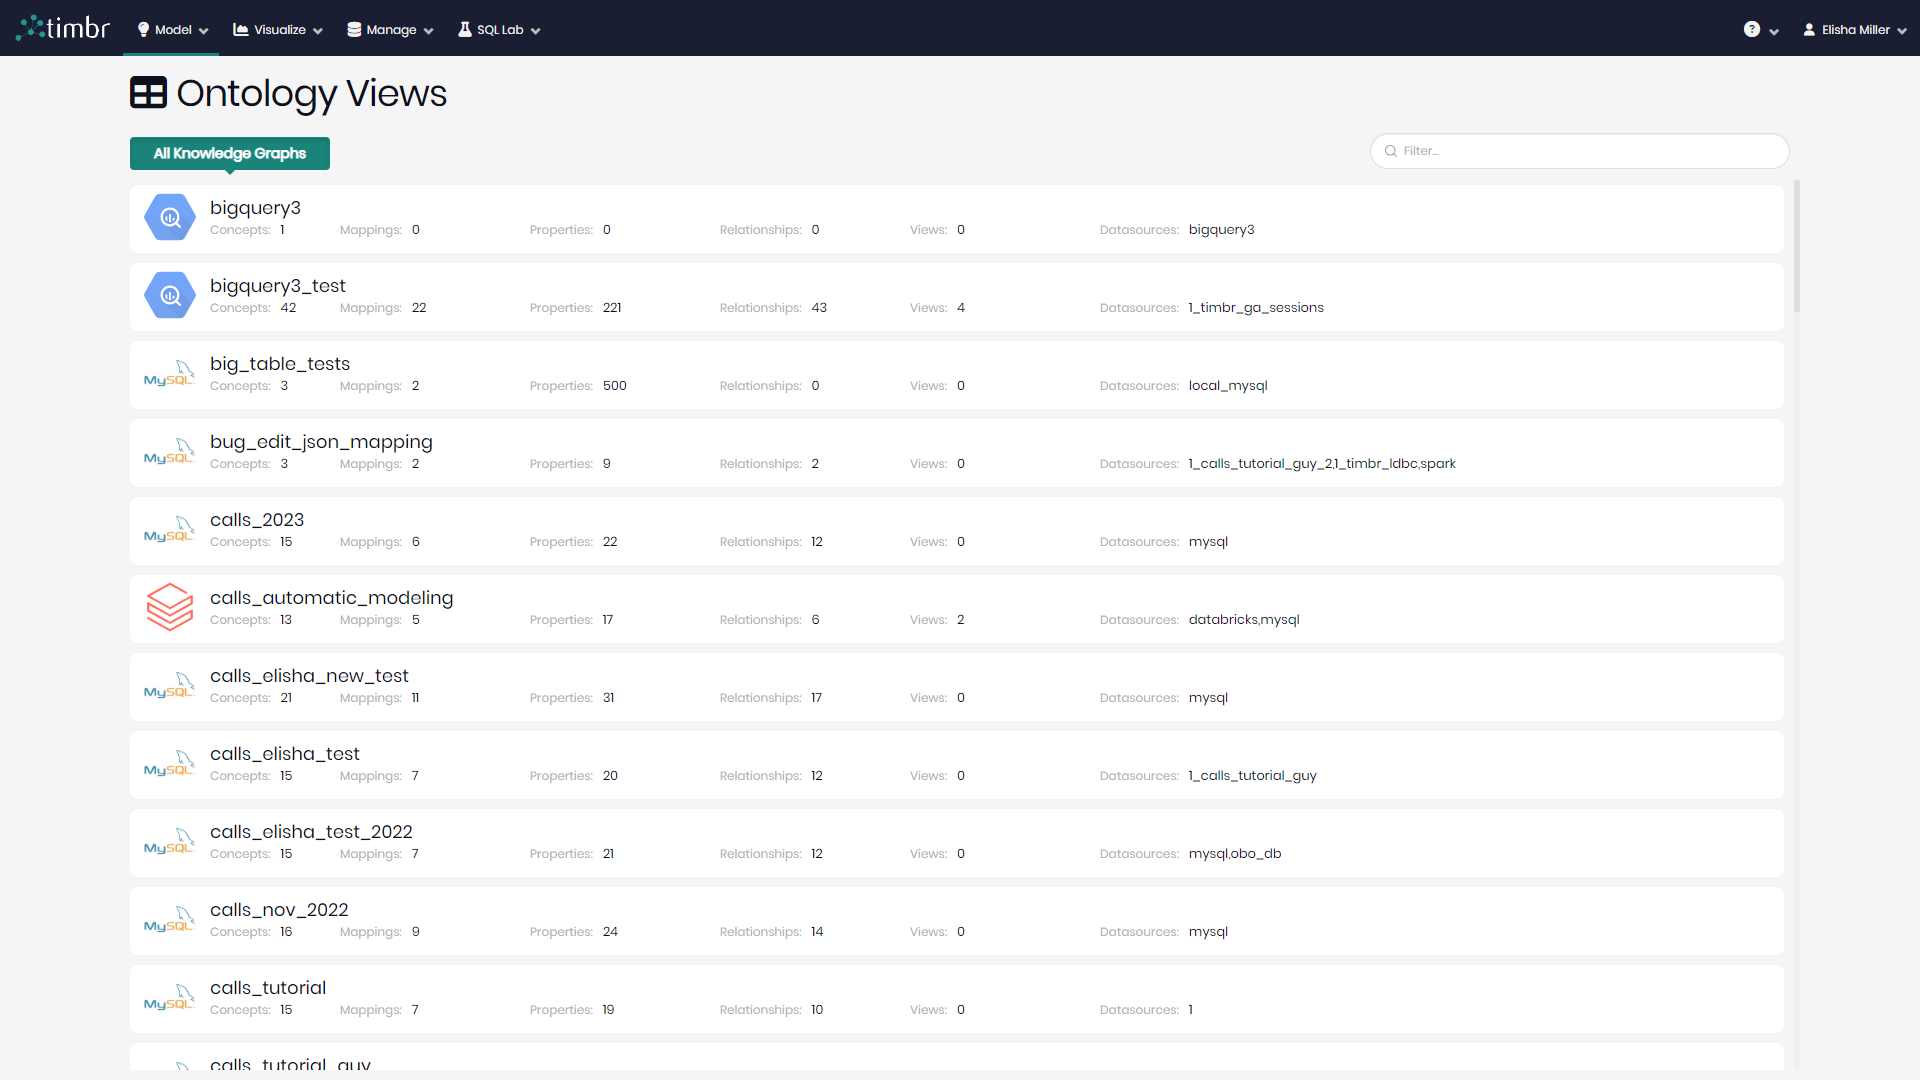
After selecting a Knowledge Graph, the main interface will display a list of all existing views and cubes (if any exist).
At the top left of the list, users can switch between knowledge graphs at any time by clicking on the arrow icons to the left of the current knowledge graph name. Beneath the knowledge graph name is the number of existing cubes and views in the knowledge graph.
On the top right is + Add new cube and + Add new view that when clicked on enables users to add one or more cubes or views to the Knowledge Graph.
Beneath the knowledge graph name and the Add new cube/view buttons, a search bar helps users locate items when many exist.
Beneath the knowledge search bar is a filter allowing users to filter by Datasource.
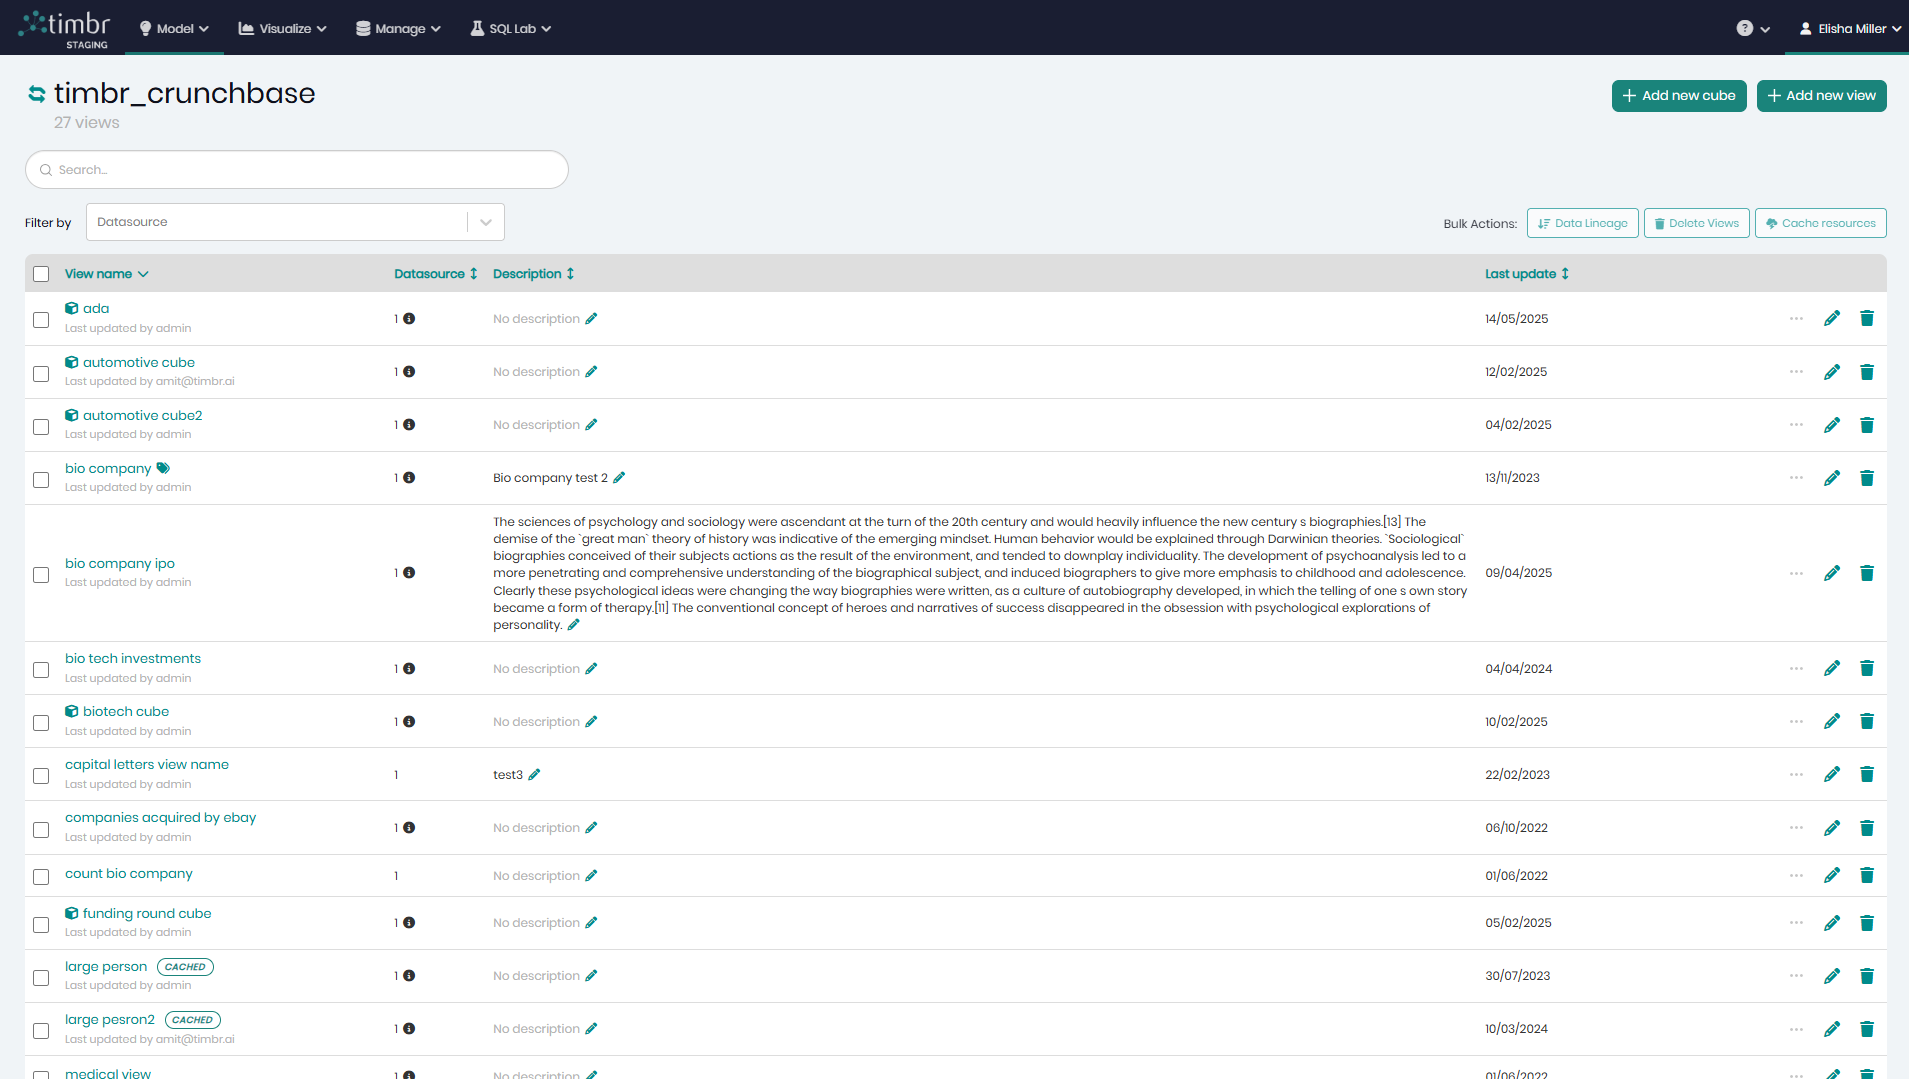
To the right of the search bar and filter, users can find three bulk action buttons.
- Data Lineage - Opens the Data lineage component for all the selected cubes and views on the list.
- Delete Views - Deletes all the selected cubes and views on the list.
- Cache Resources - Opens a window with all the cached resources connected to the current cube or view.
There are specific actions that can be performed on each item on the list. These actions appear to the right of each item, alongside its data source and description, and they include:
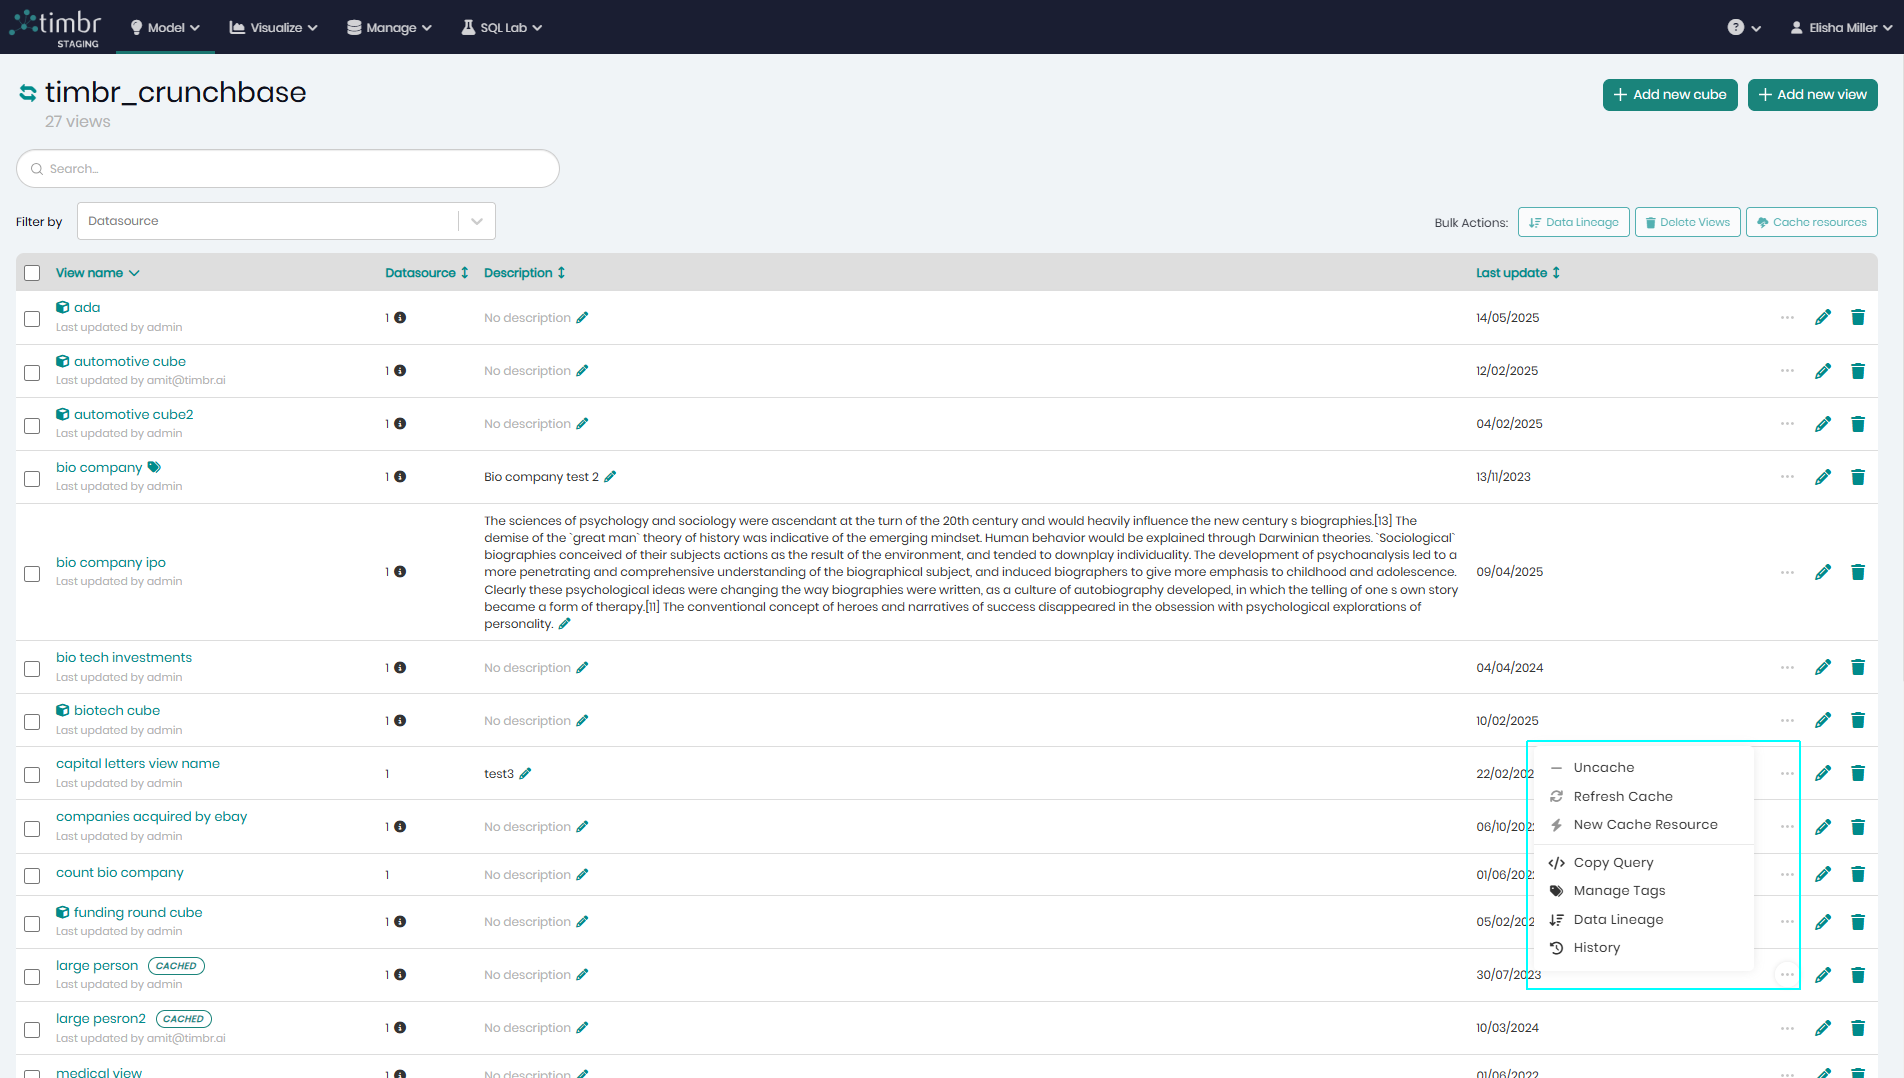
The 3 Dots – When clicking on the 3 horizontal dots, a pop-up will appear with the following options:
- Cache/Uncache Resource – Enables users to cache the data behind the selected item by simply choosing the datasource and output schema to where the resource should be cached. Or instead, uncache a resource if it's already cached.
- Refresh Cache – Refreshes the cache assigned to the selected item. This will only appear next to cubes and views with an existing cache.
- New Cache Resource – opens a pop-up window to create a new cache for the selected item.
- Copy Query - Copies the SQL query of the selected item to the clipboard.
- Manage Tags - Opens a window in order to add or edit the tags of the selected item.
- Data Lineage - Opens a window displaying the selected item's lineage on a graph so users can understand how they were created and what they are connected to.
- History - Opens a window showing the selected item's history, stating when they were created, edited, and when different actions took place on them.
Edit Cube/View - Click the edit pencil icon to modify the selected cube or view.
Drop Cube/View - Click the remove trash can icon to delete the selected cube or view from the list.
Timbr enables users to differentiate between cubes and views that are not cached with those that are. Cached items display a cache icon next to their name.
Hover over the icon to see:
- Total cached rows
- Time and date of caching
- Data sources used
![]()
Creating a New Cube
Once + Add new cube is clicked on the top right, a window will appear in order for users to create their cube.

On the top right users can switch the Creation Method toggle to create the cube in SQL and not just in a visual manner.
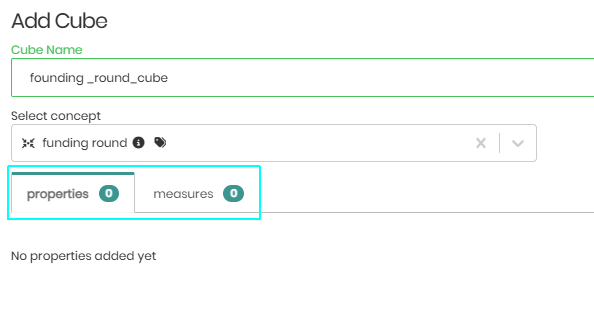
- The first step is to give the cube a Name and an optional Description.

- Next, the concept the cube is being based on should be selected from the dropdown.
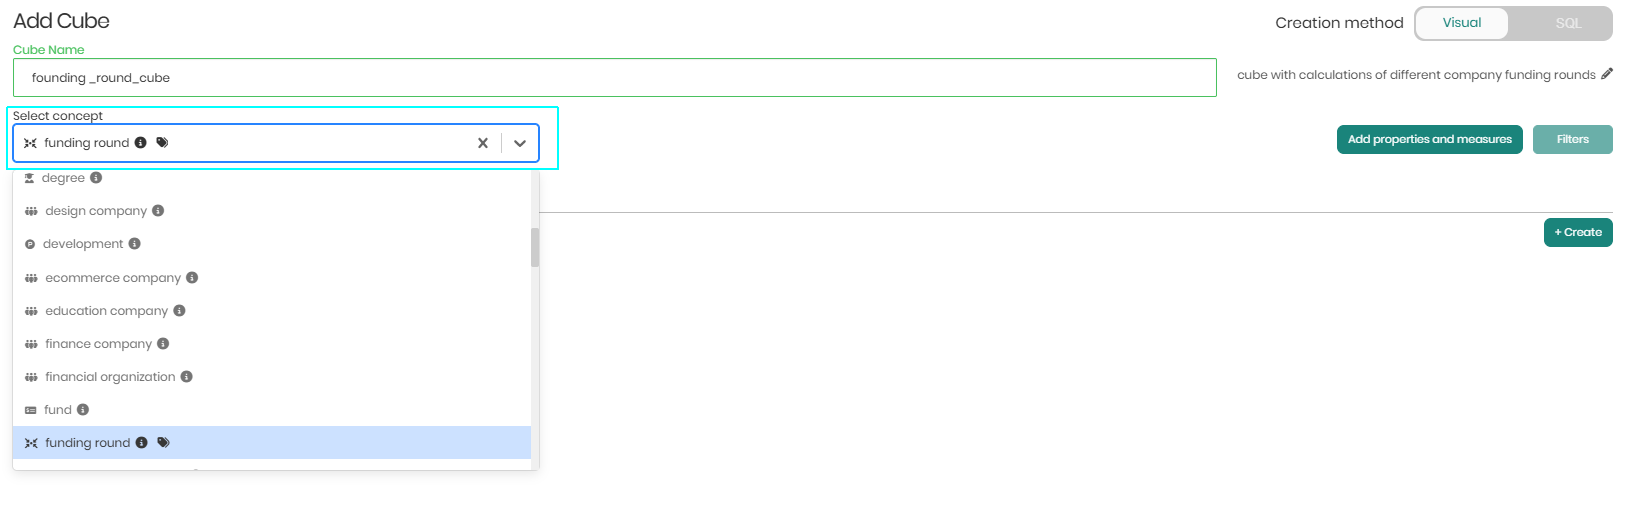
Once the concept is selected, at this stage users will see two tabs, the properties tab and the measures tab.
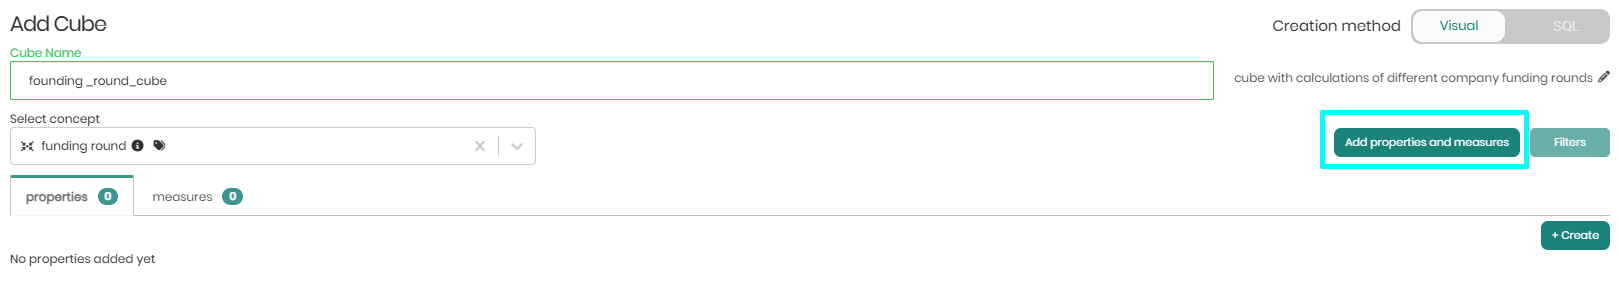
- Both new properties and measures can be defined and added to the cube by clicking create on the right side of each tab.

- Users can also click on Add properties and measures to add existing properties and measures to the cube in bulk.
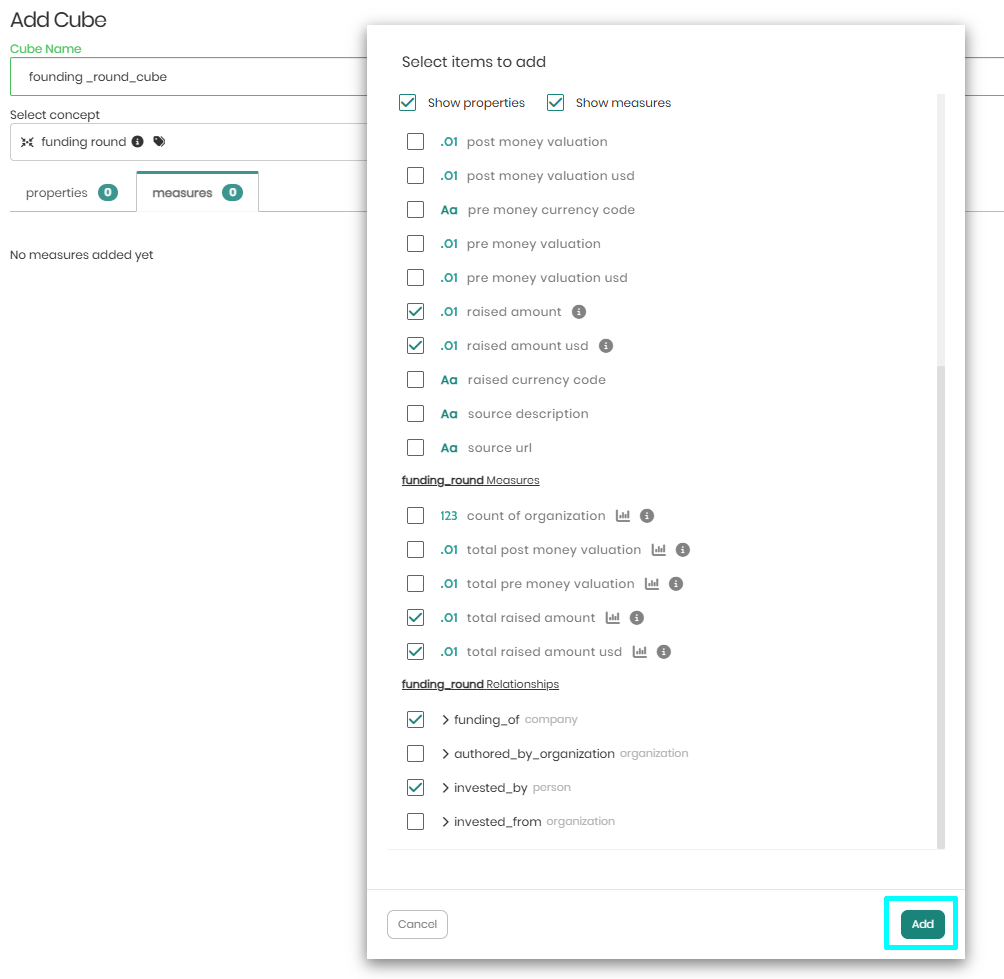
- Once clicked the entire list of existing properties and measures will appear for easy addition to the cube. The list includes properties from the selected concept and from any related concepts through defined relationships. Once selected click Add on the bottom right.
- After adding the desired properties and measures, all the properties and measures selected will appear in each of the two tabs. Once everything looks correct users on the bottom right can click on preview SQL to see the SQL being generated to create the cube. Next to preview SQL users can click on Save new cube to save and create the new cube.
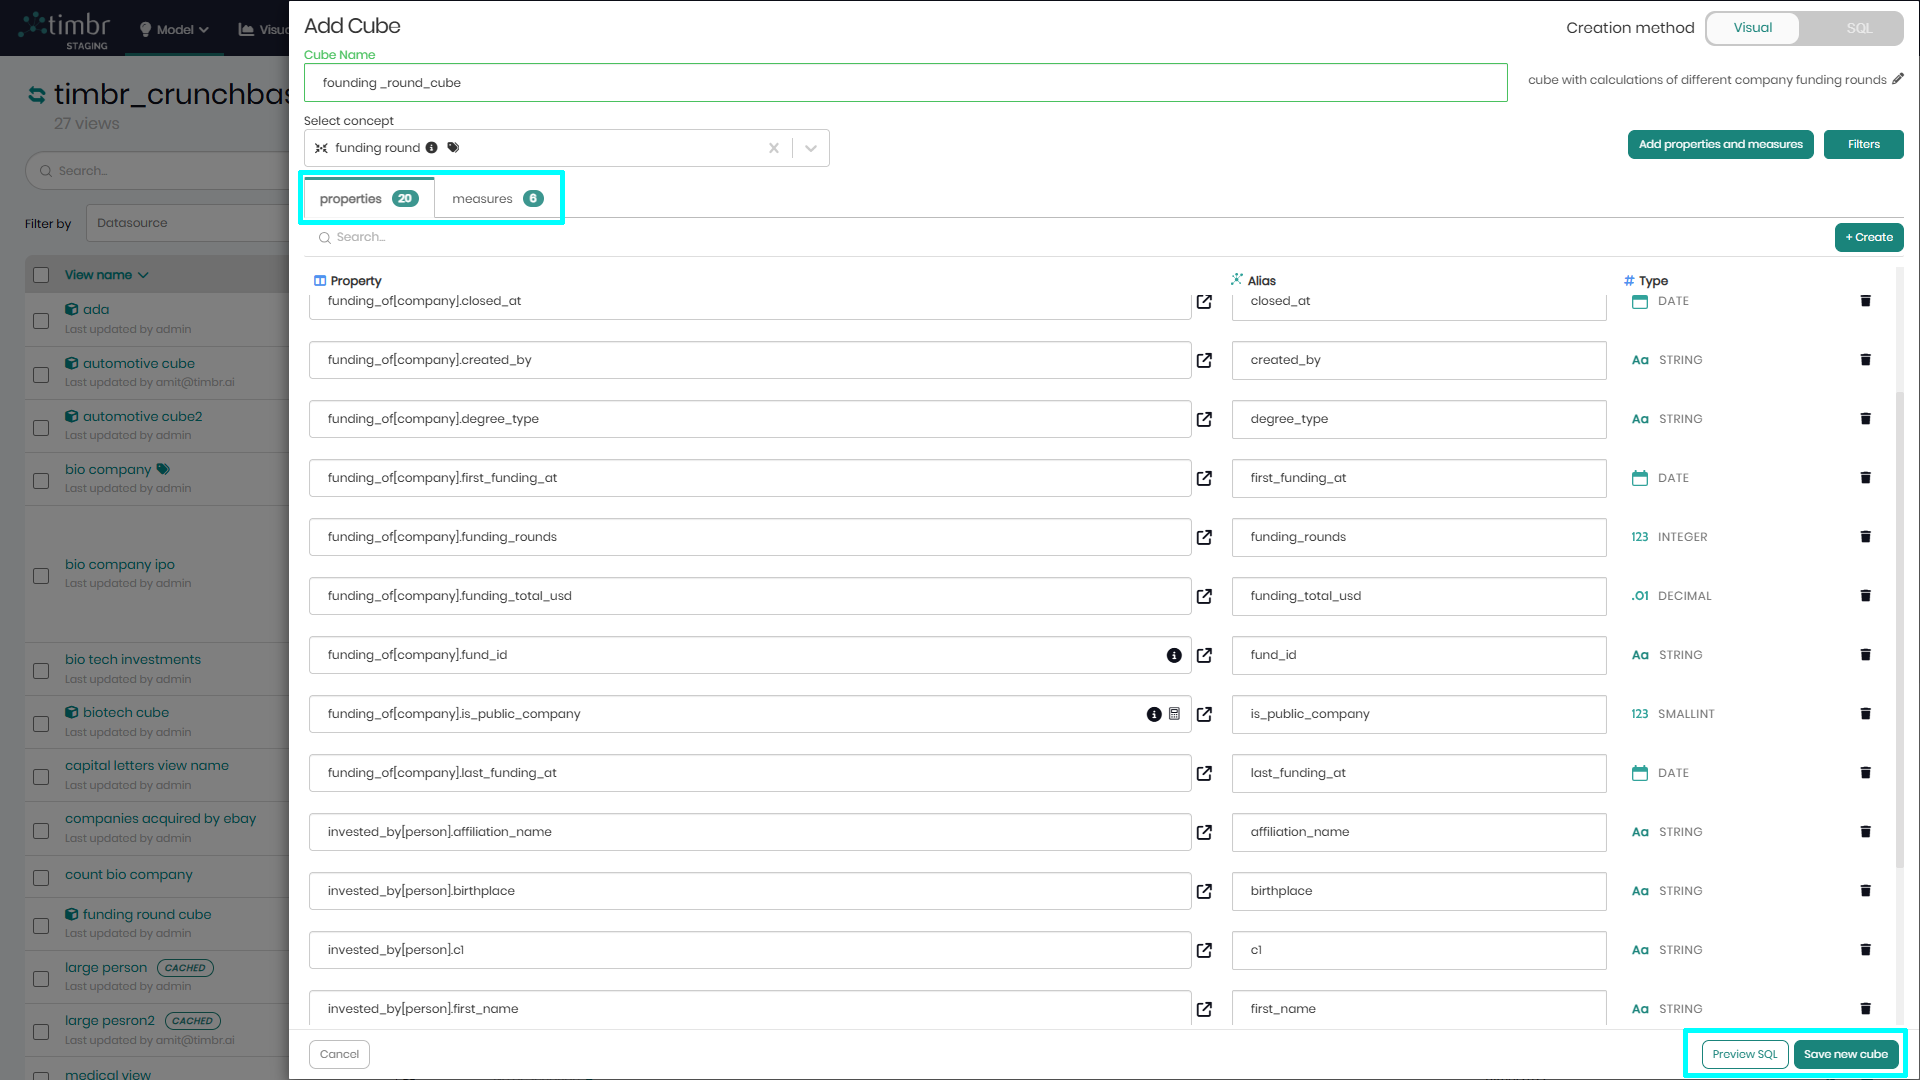
Once saved, the cube will appear in the list of cubes and measures with a cube icon next to it.
![]()
Creating a New View
Once + Add new view is clicked on the top right, a window will appear similar to the SQL Editor in order for users to enter their SQL statements that will create their view.
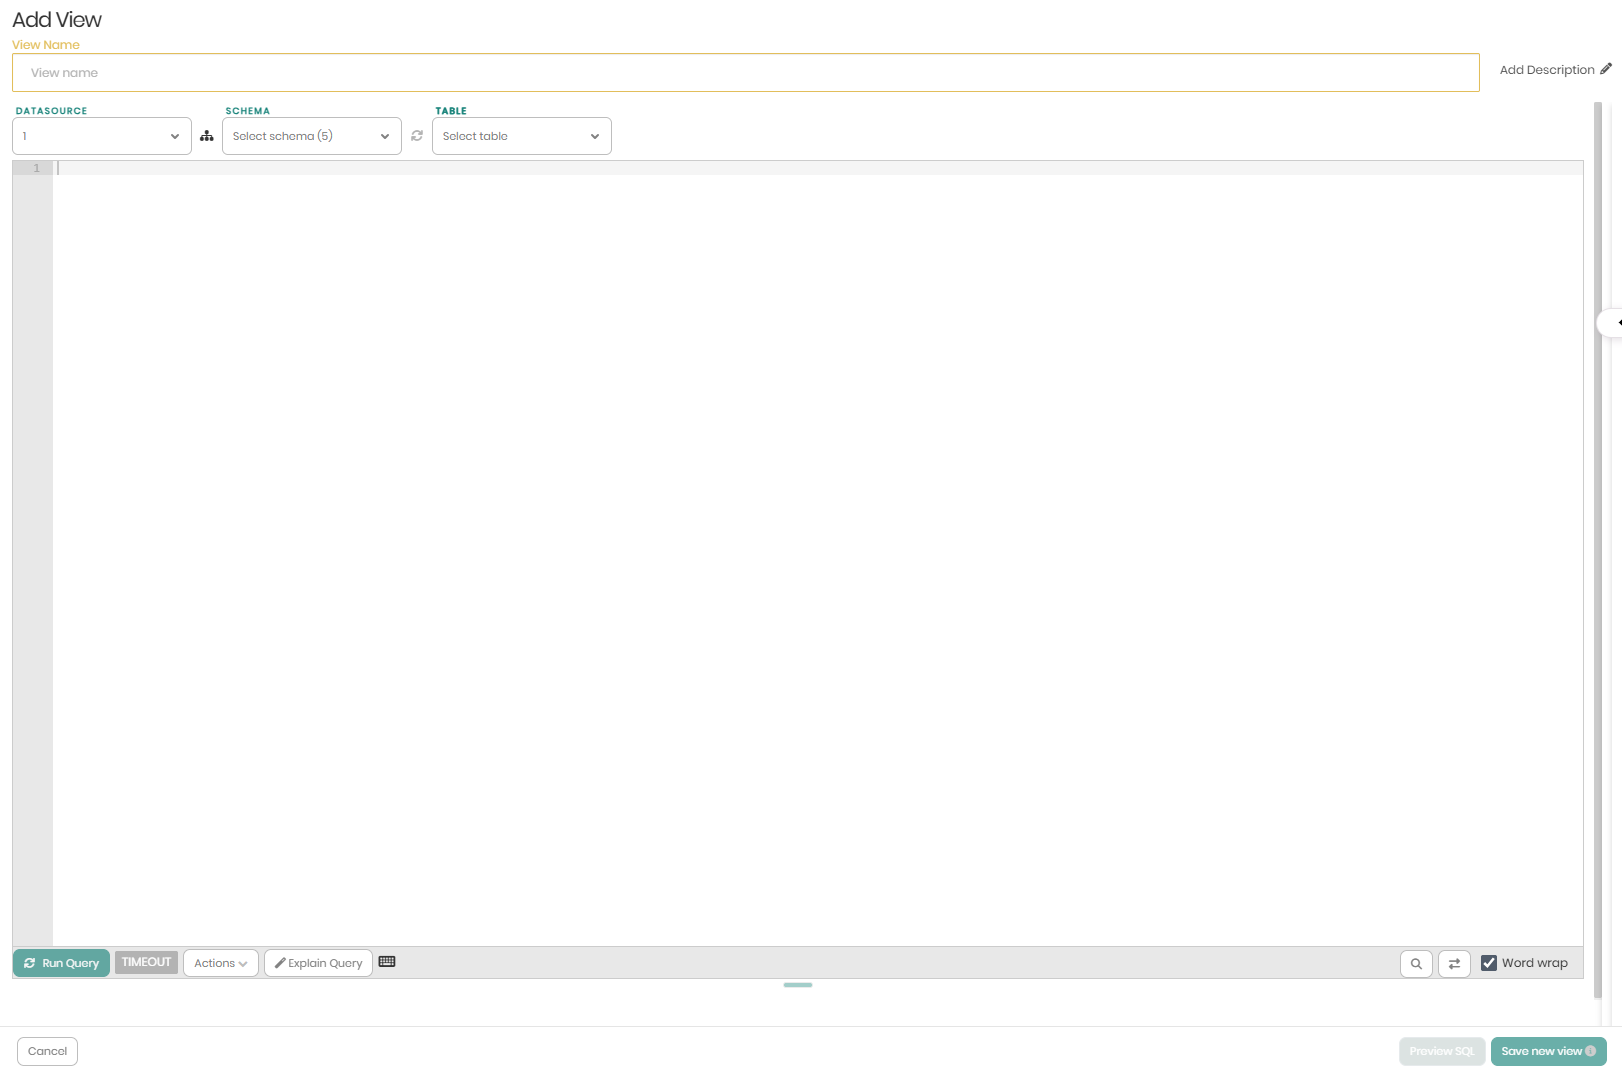
- In the main SQL screen, the first step is to give the view a Name and an optional Description.

- Next, the SQL statement should be entered in the main box. Users can choose their Datasource, Schema and Tables to assist them in building their views.
- Once the SQL statement is prepared, at this stage users can simply click on Save new view on the bottom right, to complete the view and save it.
![]()
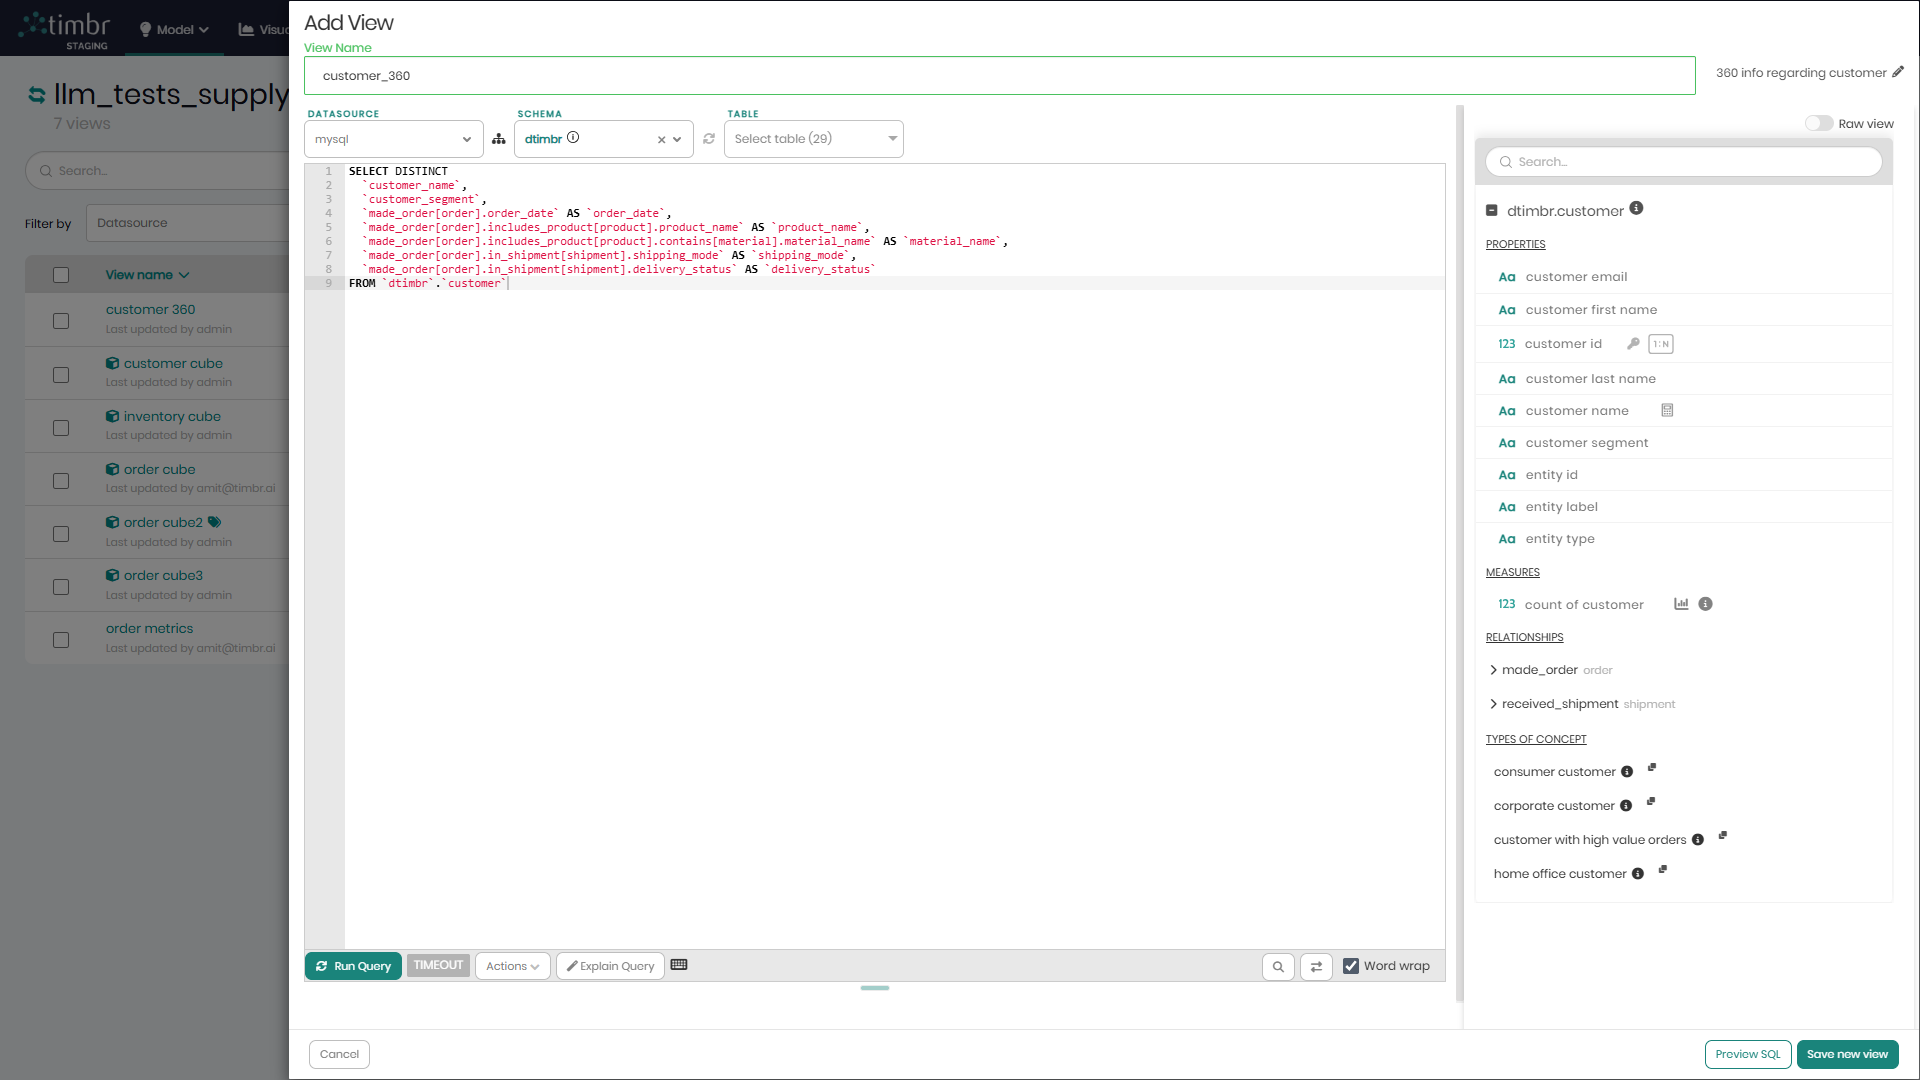
There are additional options before saving the view, which can be found beneath the query box in the query toolbar.
![]()
Those options include:
Run Query - Runs the query in the main query box. This enables users to see what the query results behind the view look like.
Timeout - Determining the query timeout in seconds. When left empty default timeout will be in effect.
Actions - When clicked on, a dropdown opens with the 2 following options:
- Save query - Saves the current query which can later be found in the SQL lab tab under Saved Queries.
- Map to concept - Enables to map the query results to a chosen concept in the knowledge graph.
Explain Query - This opens an explain query window which presents the query that was pushed down behind the scenes of our current query to the datasource. This enables users to see what their query would look like without Timbr's relationships and business logic, where users would need to write up to 90% more code.
Keyboard shortcuts and snippets - Presents various shortcuts and snippets helping users write and run queries faster.
Search for - This enables users to search for specific words or phrases used within the query written above, which can come in handy when writing longer queries.
Replace with - This enables users to replace specific words or phrases used in the query written above with other words or phrases of their choice.
Word wrap - When the word wrap checkbox is marked, word wrap will be activated and any text that exceeds the length of any specific row will be pushed down to the next row. When the word wrap checkbox is unmarked text on any row can continue until specified otherwise.
Query timer - Shows the query run time once run query is clicked.
In the results section below, users are offered additional features which can be found right above the results box on the upper right side.
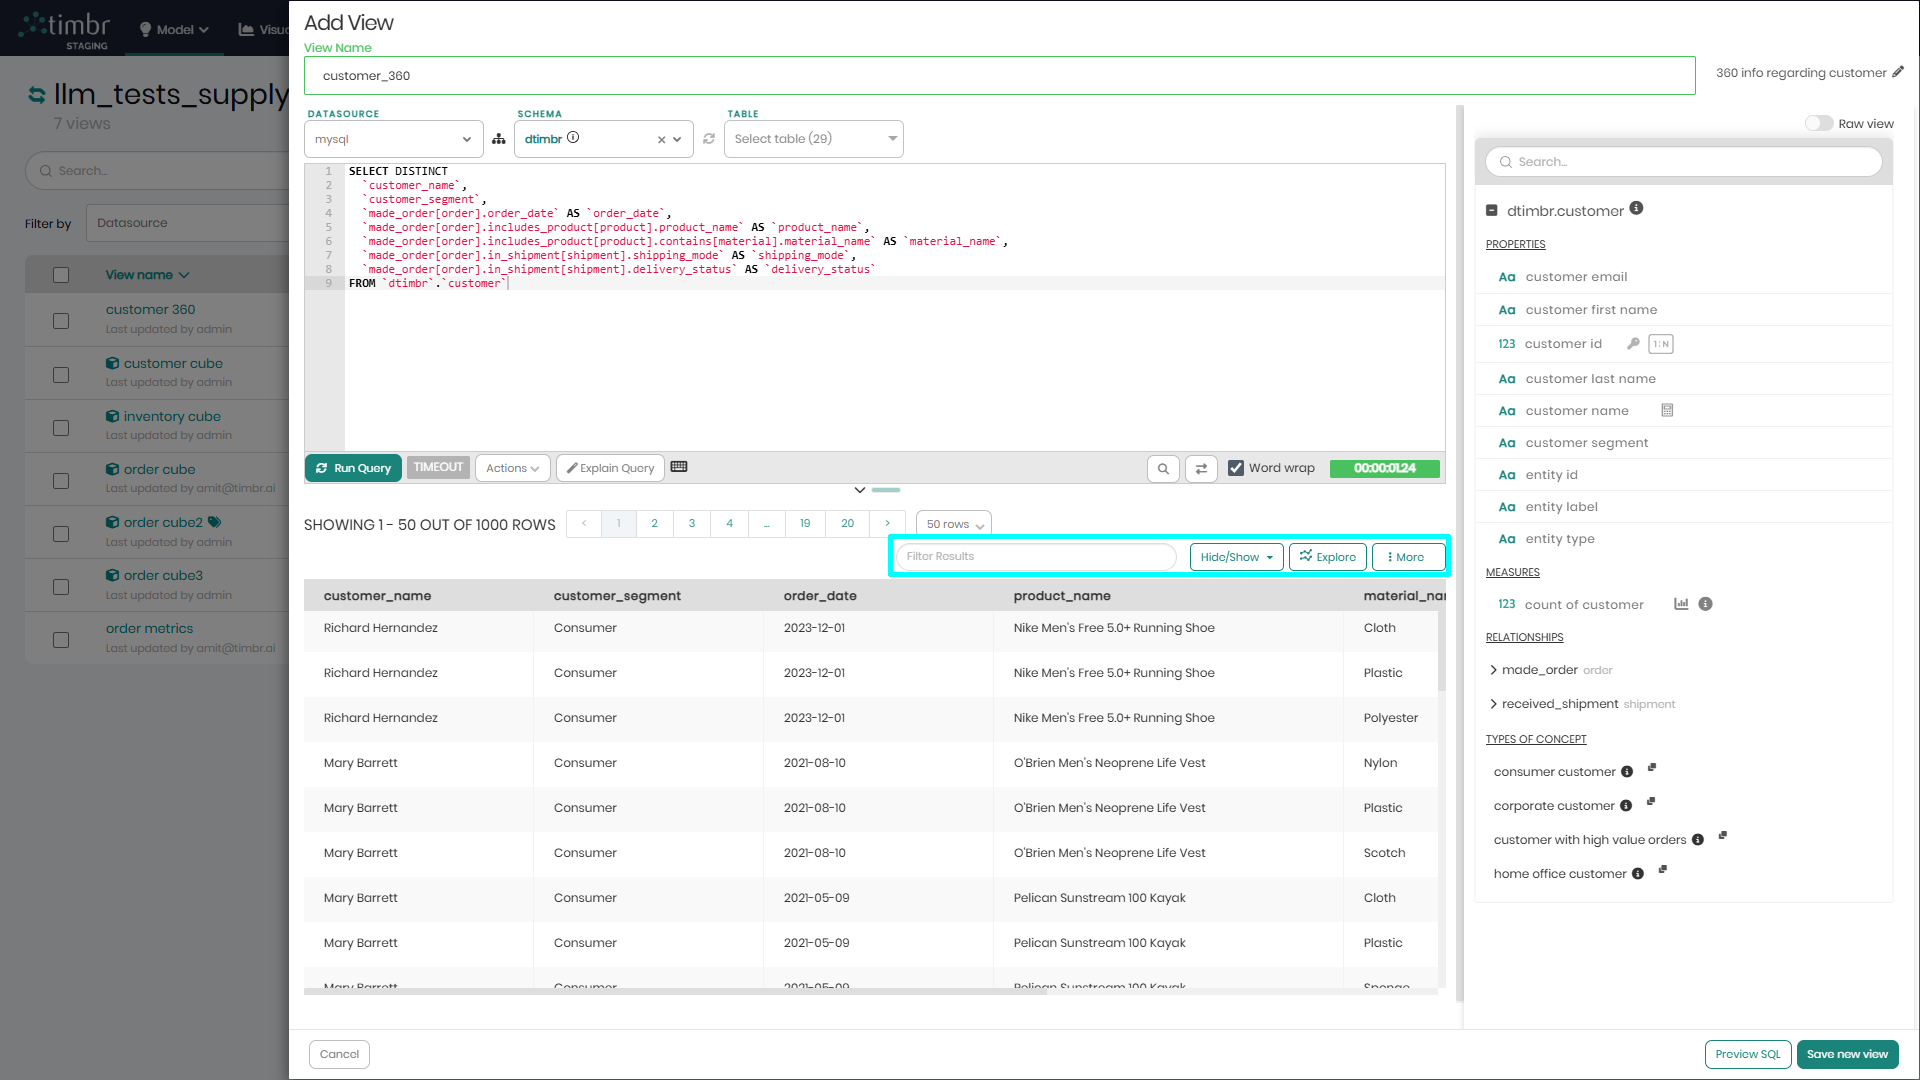
These options include:
Filter Results - A search bar to type and filter for specific results.
Hide/Show - Choosing which result columns to hide and which to show.
Explore - Enables users to transfer the query results to Timbr's built-in BI module to explore and present the results using any of the various charts offered by Timbr.
More - The more button gives users additional options which include:
- Remove null columns - Removes all the null columns in the query results.
- Export result set - Exports the query results as a CSV, JSON or TEXT file.
- Results Stats - Presents different stats of the query such as total rows, columns, cells, existing values, nulls, query limit, query runtime, query start and end date.
- Clipboard - Copies the entire results to the clipboard to be used anywhere.
- Show column stats - Adds stats above the different columns such as unique values, null values, Min, Max, Avg and more.