Embed Saved Exploration in Power BI
In this page you will learn how to embed a Graph Explorer saved exploration in Power BI.
The embedded exploration uses a parameterized Natural Language Query, allowing dynamic filtering within Power BI while preserving the underlying semantic model.
The Timbr platform must have the TIMBR_ALLOW_EMBEDDED_IFRAME environment variable present with any value (by default it's omitted) in order for the HTML embedding of the saved exploration to work.
The steps for embedding the Graph Explorer saved exploration in Power-BI are as follows:
- Create a parameterized saved exploration and download the values to filter the visualization in Power BI.
- Integrate the saved exploration in Power BI
Create a saved exploration based on a new Natural Language Query parameterized query.
- Create the saved exploration used for the integration in Power BI.
- Download the values used to filter the saved exploration in Power BI with a different visualization.
- Get the URL of the embedded saved exploration so that you can use it in Power BI.
Create and save the parameterized Natural Language Query
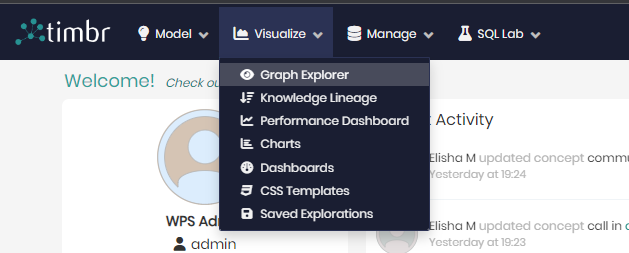
In the Timbr platform, visit the Graph Explorer page by selecting Visualize and choose the Graph Explorer option from the main navigation menu.
After choosing your Knowledge Graph, click on the Natural Language Query tab and create the base query template you want to embed in Power BI.
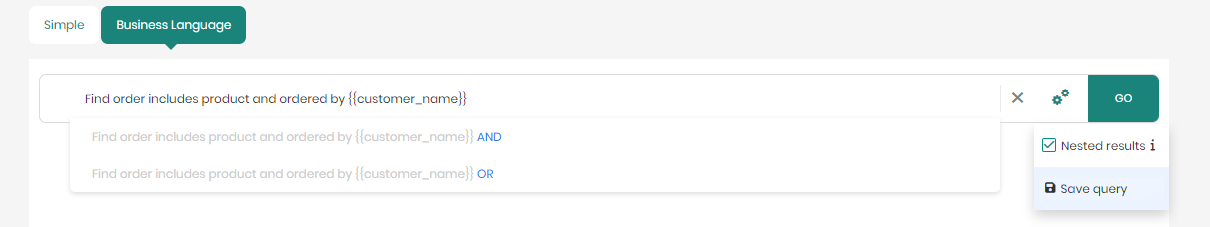
The parameters in the Natural Language Query are encapsulated in double curly-brackets {{<property_name>}} where property_name is the name of the parameter key which will be used in the URL, together with the value which will be filtered by. For example, if the property name we want to use is client_name then producing the parameter {{client_name}} will be used as part of the URL as https://<host>/timbr/embedded/<exploration_name>?token=<token_value>&client_name=John Smith
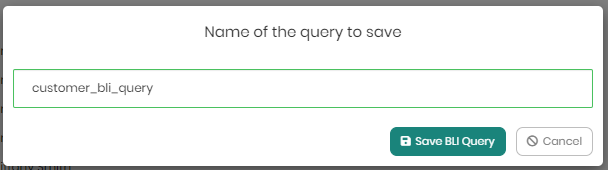
After entering the query, click on the double cog icon (next to the GO button) and choose the Save query menu item.
Type the name of the exploration as it will be saved and used in the URL of the saved exploration.
Download the values to filter the saved exploration
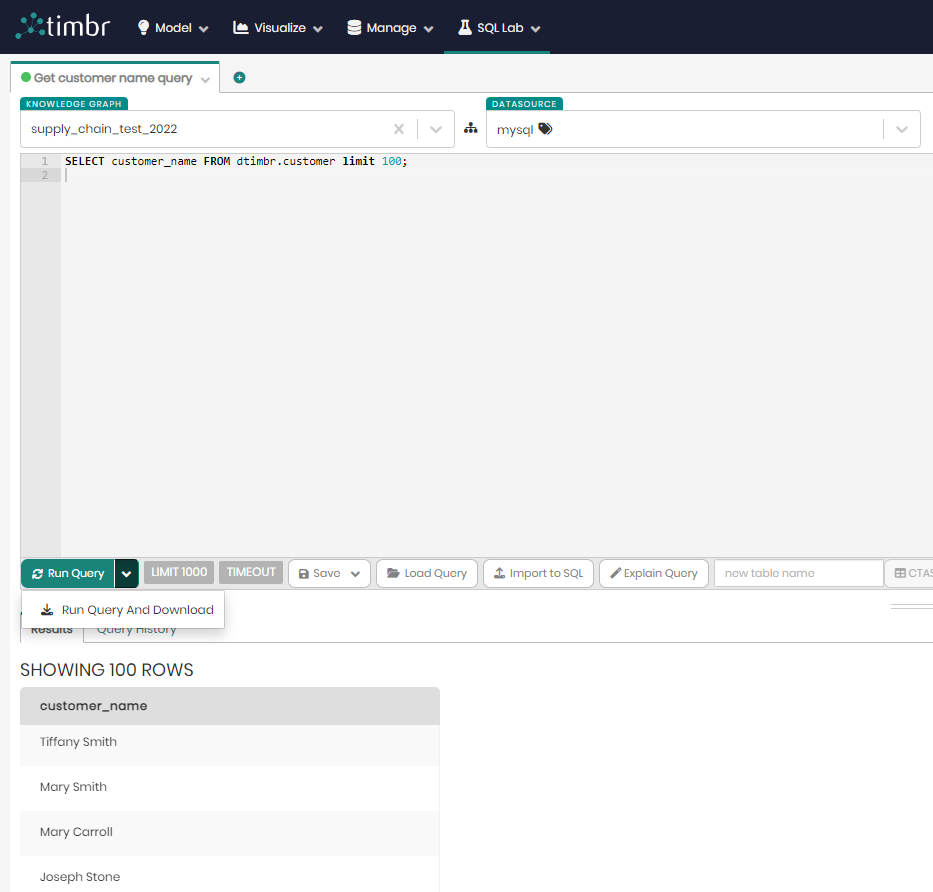
In the Timbr platform, visit the SQL Editor page by selecting SQL Lab and choose the SQL Editor option from the main navigation menu. Next, choose the Knowledge Graph of the saved exploration, and insert the query selecting the property name used as a parameterized variable from the previous step to get a list of values for the property name.
The query should have the pattern of:
SELECT distinct <property name> from dtimbr.<concept of the property used in Natural Language Query>
After inserting the query containing the values used to filter the saved exploration, download the results in order to load them in Power BI.
To do so, click on the down arrow (In the Run Query button) and select Run Query And Download so that the query will be run and also a file will be downloaded with the results.
The downloaded file is used as a CSV datasource in Power BI in order to filter the saved exploration later on
Get the URL of the embedded saved exploration
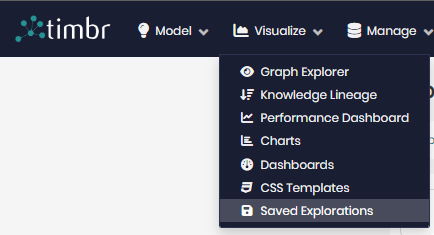
In the Timbr platform, visit the Saved Explorations page by selecting Visualize and choose the Saved Explorations option from the main navigation menu.
Since the query is saved with a variable, Timbr will try to query using a variable name instead of a value so no results will be displayed when trying to access the Graph Explorer
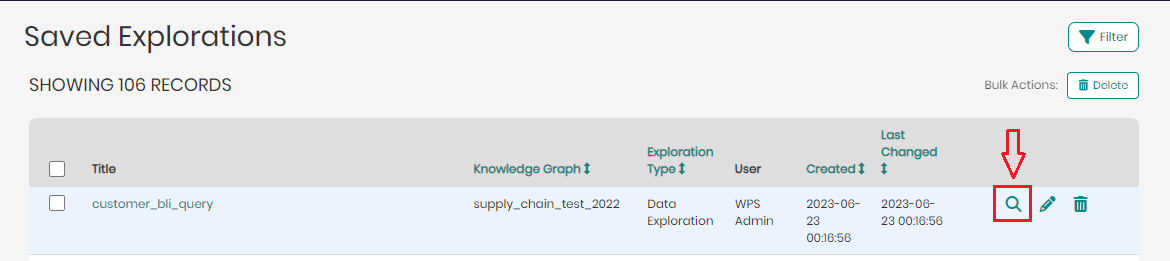
Click on the magnifying glass icon in the row of the saved exploration to enter the view page of the saved exploration.
Copy the value of the URL in the iframe code which is located in the last row named Embeddable script
![]()
Now that we are all set on the Timbr side, we are ready to embed the saved exploration in Power BI.
Integrate the saved exploration in Power BI
Integrating the saved exploration in Power BI requires the following steps:
- Importing the CSV file of the property values as a datasource in Power BI.
- Adding the visuals to the Power BI report. One for selecting the values to filter, and another to display the saved exploration from the Timbr platform.
- Creating the measures for the filter and the embedded visuals.
Importing the CSV file of the property values
- Open Power BI and create a new report, when the splash screen opens choose the Get data option.
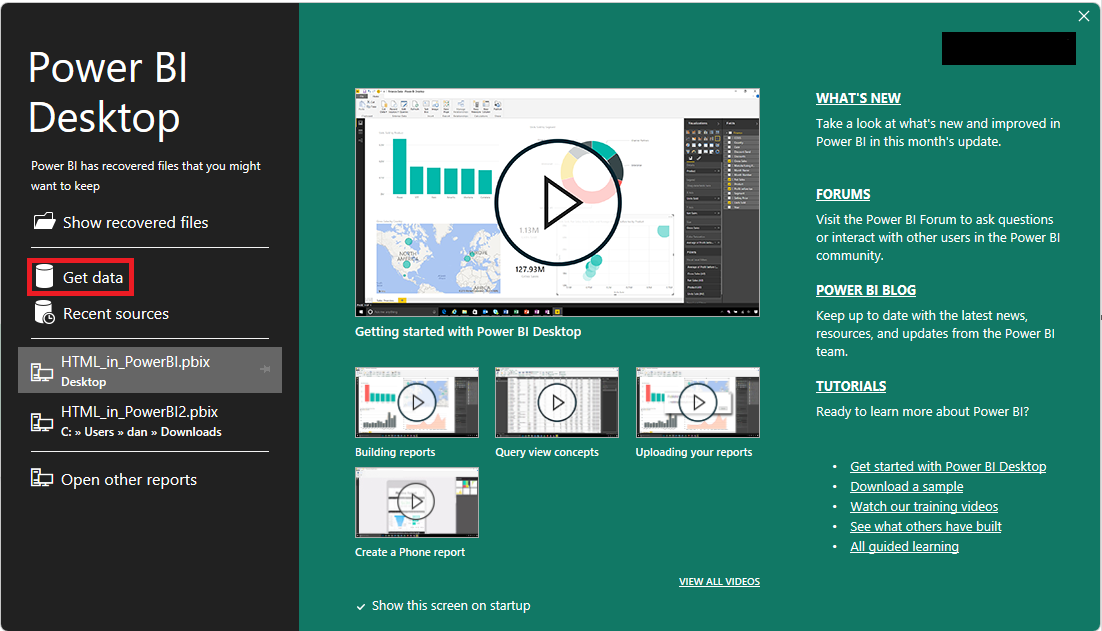
Alternatively, if the splash screen doesn't show, you can choose the Get data from another source link.
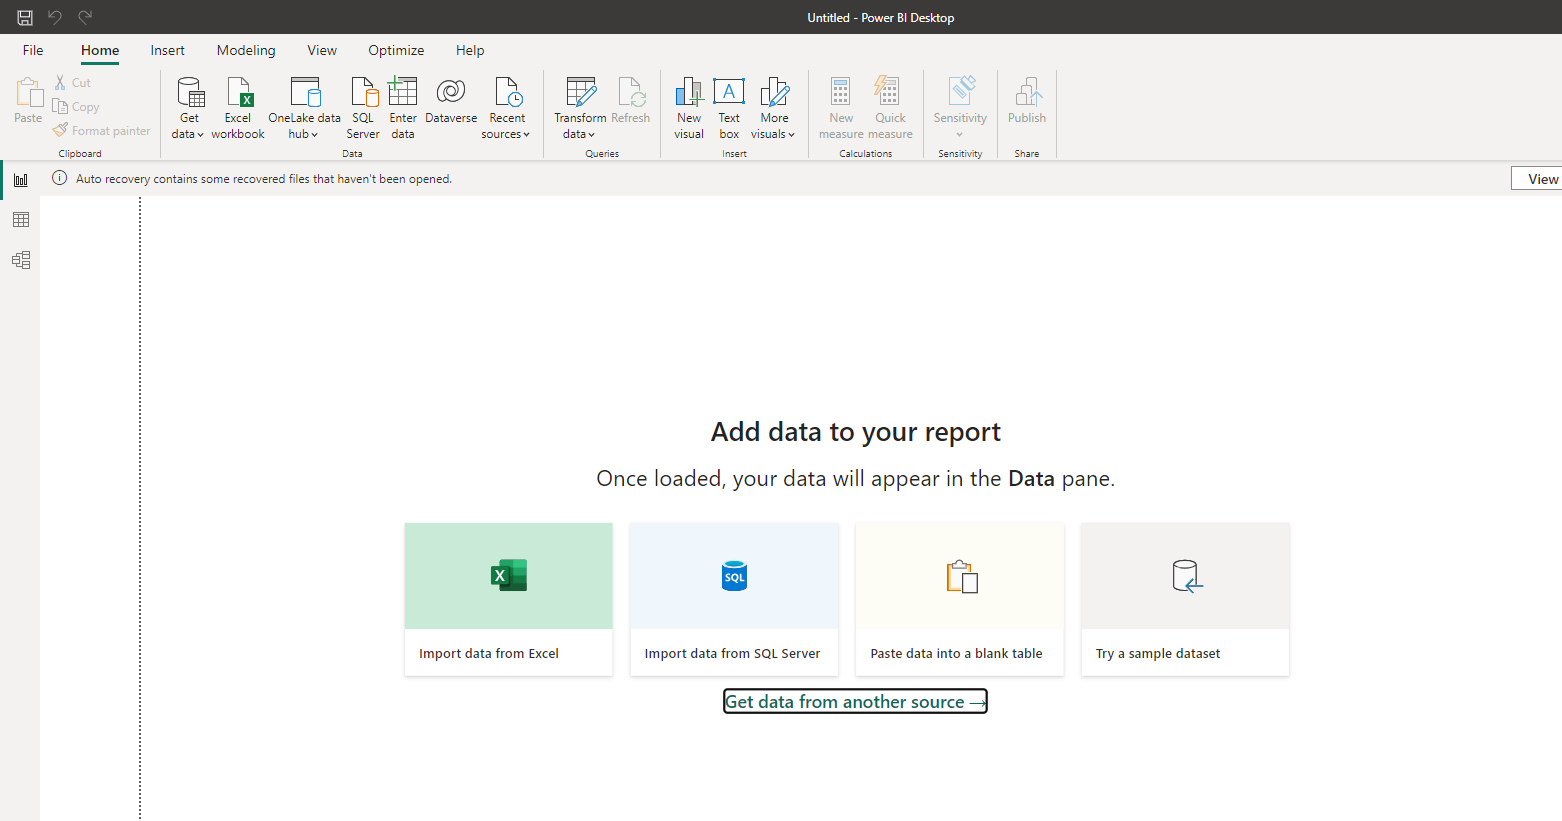
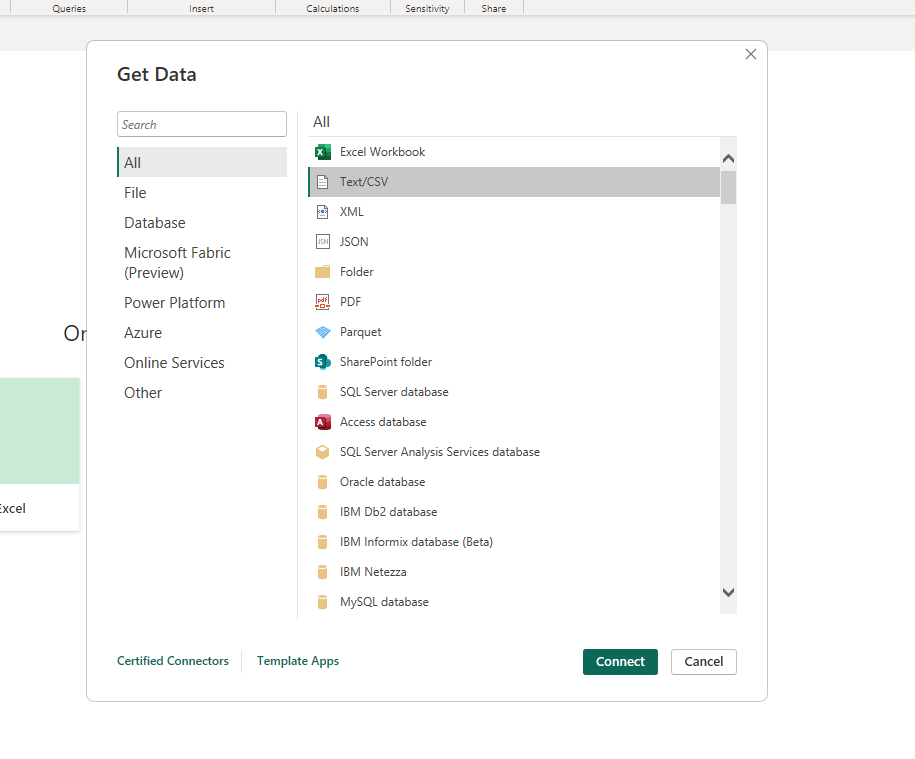
- From the options presented choose the Text/CSV option and click on the Connect button.
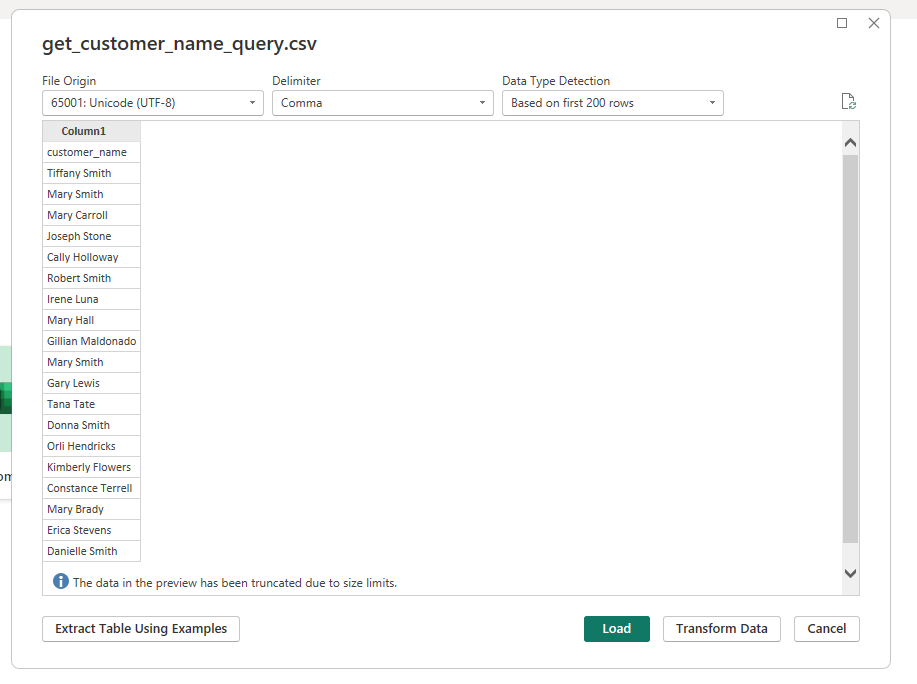
A dialog box will open, choose the downloaded CSV file of your saved exploration you downloaded from Timbr, and click on the Open button.
A new screen will appear which will show you the data of the CSV file you selected. If everything looks correct click on the Load button.
Adding the visuals to the Power BI report
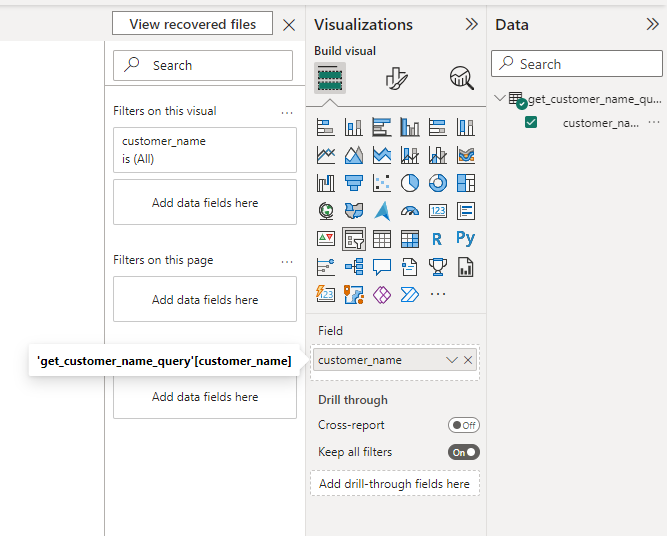
- After the page loads, choose the Slicer visualization which will be used to filter the saved exploration visual.
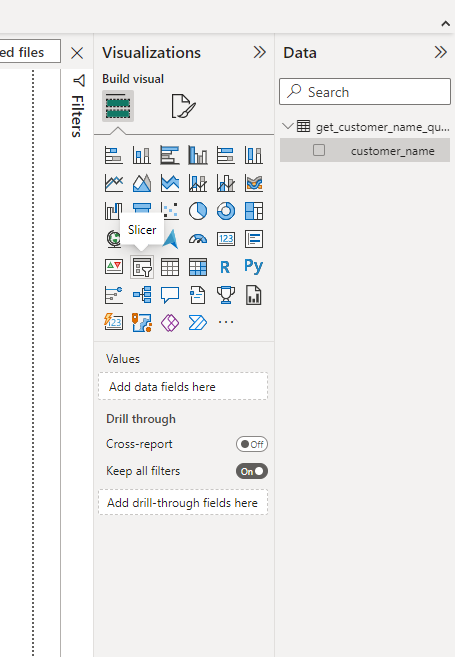
- On the right, drag the name of the property (which is exposed as a column) to the Field input box to load the data from the column into the Slicer visual.
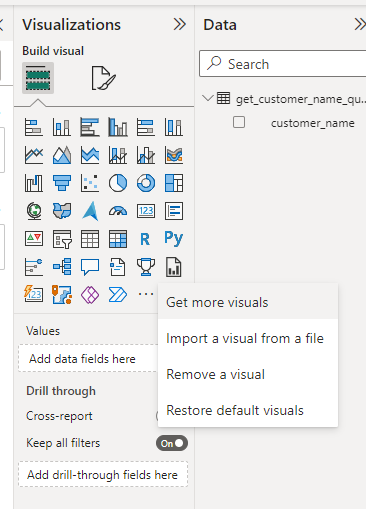
- In the Visualizations section, click on the three dots to open a dropdown menu, and select the Get more visuals option.
- In the top-right corner, search for a visual named HTML Content by Daniel Marsh-Patrick. The visualization is free of charge and open source. For more information check the FAQ in HTML Content website
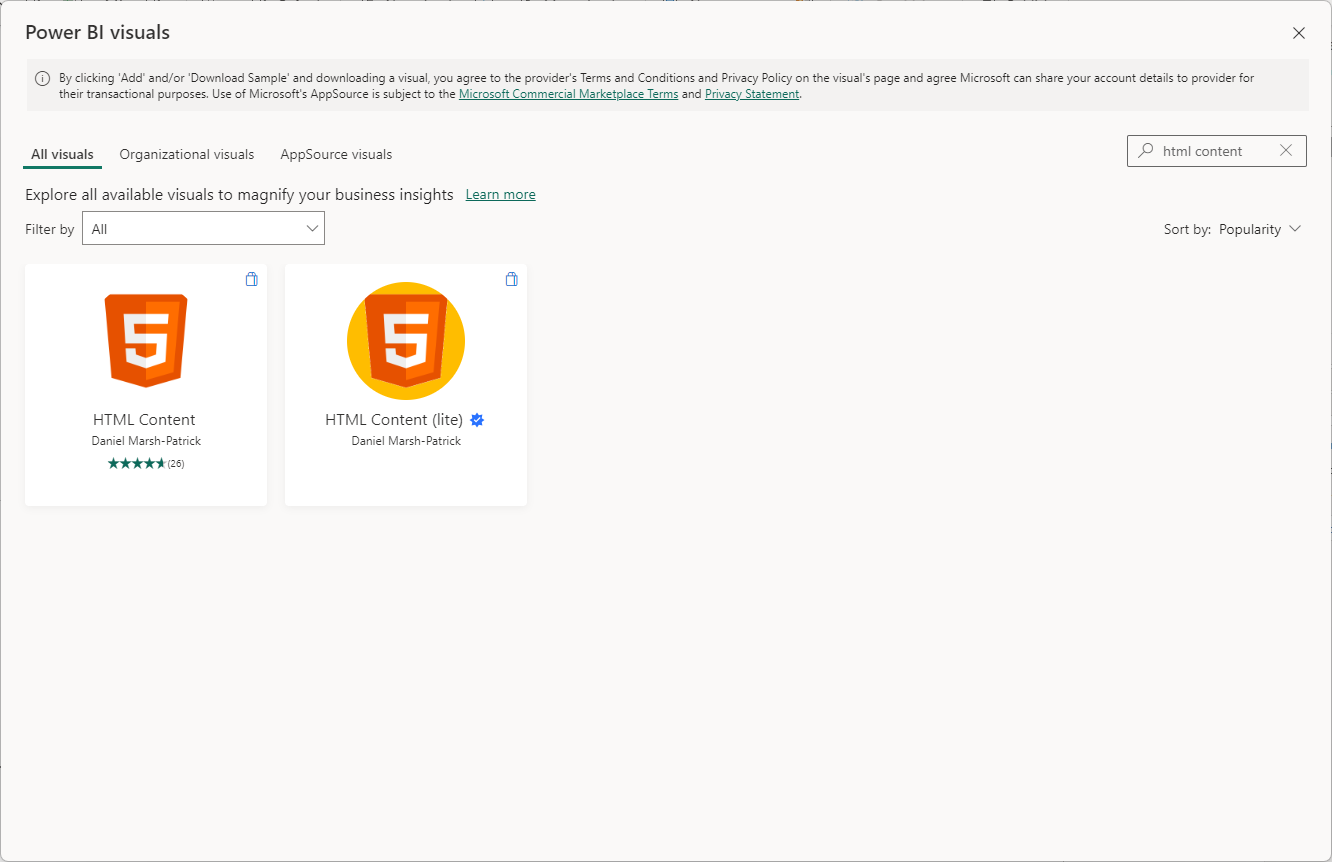
- In the HTML Content product screen, click on the Add button to load the visualization in Power BI.
- A new icon of the HTML Content will appear in the Visualizations section, click on it and drag it to resize for your fit.
Creating the measures for the filter and the saved exploration visuals
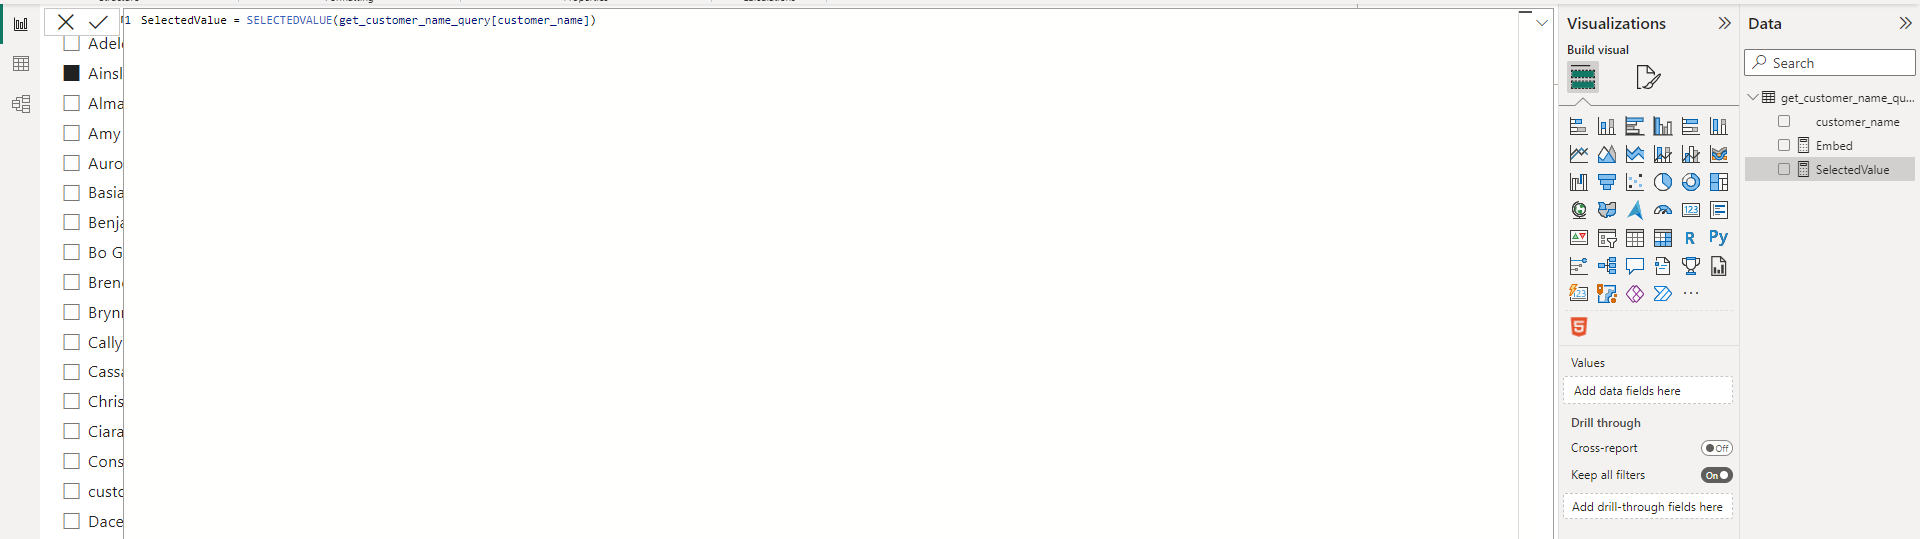
In the Data section, right-click on the datasource name, and from the dropdown menu choose New measure.
In the code area of the new measure, create a new variable that will be used as the selected column name in the filter section, and click on the checkmark on the left to commit the measure. The code should be in this form:
SelectedValue = SELECTEDVALUE(get_customer_name_query[customer_name])
SelectedValueis the name of the new variable we will use to represent the selected value in the column list of the Slicer visual.SELECTEDVALUEis the name of the DAX variable used to denote the selected value in the column list of the Slicer visual.get_customer_name_queryis the name of the datasource, or the CSV filename from which we imported the values list.customer_nameis the name of the property (or alternatively, column) that holds the selected value.
In the Data section, right-click on the datasource name again, and from the dropdown menu choose New measure again.
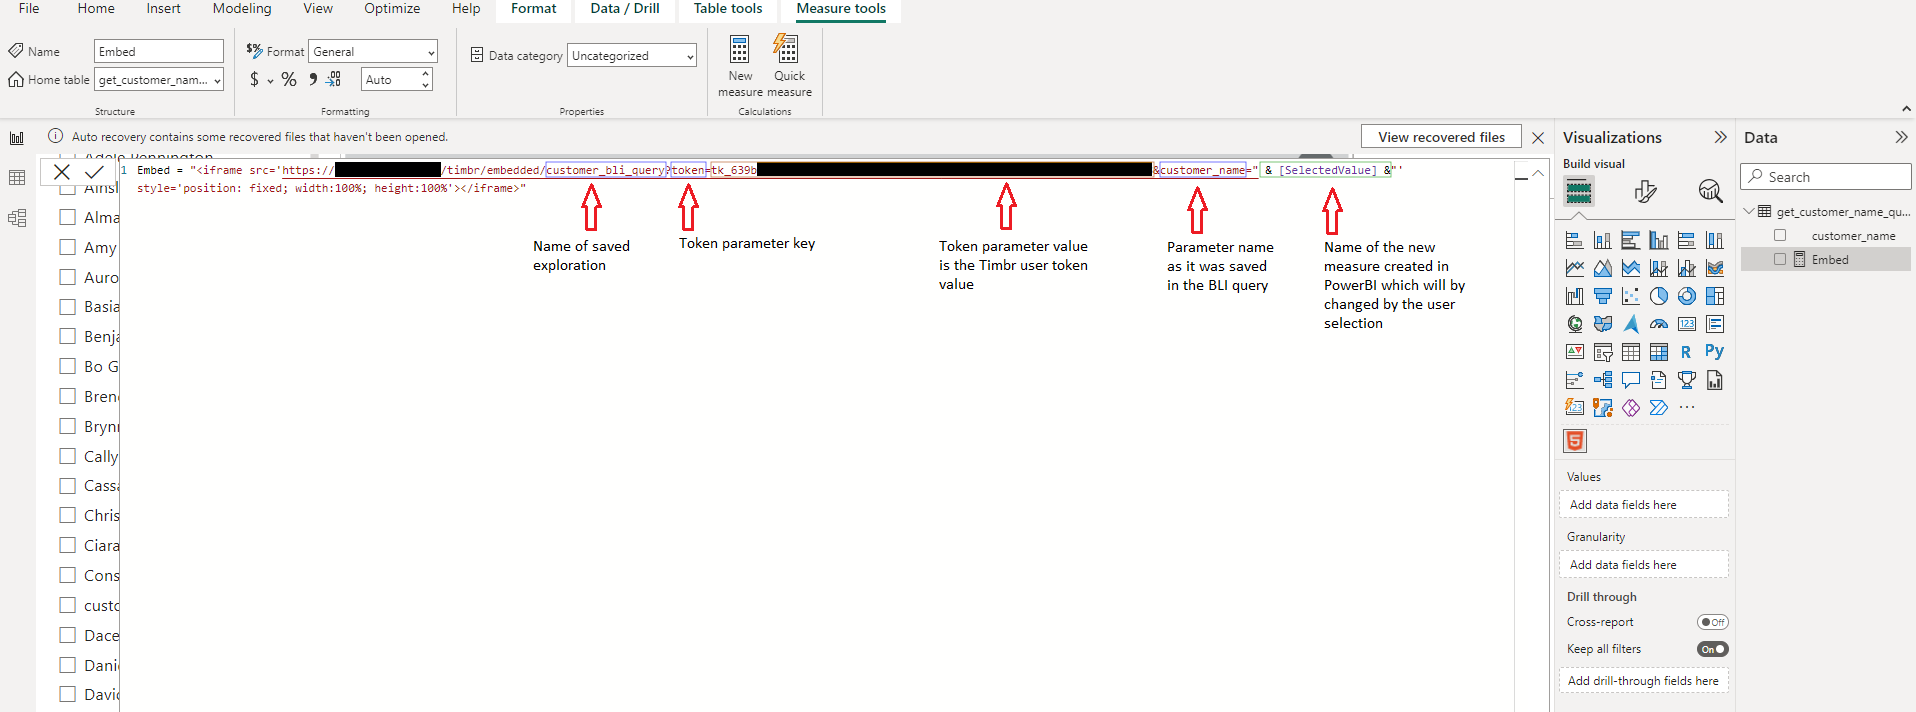
In the code area of the new measure, create a new variable that will be used as the embedded script for the saved exploration, and click on the checkmark icon to commit. The code should be in this form:
Embed = "<iframe src='https://<hostname>/timbr/embedded/<saved_exploration_name>?token=<token_value>&<property_name>=" & [SelectedValue] &"' style='position: fixed; width:100%; height:100%'></iframe>"
This is a DAX script that contains HTML code that will embed an iframe based on the source of the saved exploration.
Embedis the name of the DAX variable used to denote the embedded HTML string for the HTML Content visual.<hostname>- required - is the name of the host where the saved exploration is stored.<saved_exploration_name>- required - is the name of the saved exploration we want to embed.<token_value>- required - is the value of the user token used to authenticate with Timbr. Click here for how to get a Timbr user token.<property_name>- required only if the saved exploration is based on a parameterized property ({{ .. }}) - This should be thekeydenoting the property name." & [SelectedValue] & "- required - This means we want to use the value that we select from the measure we created in step 12.
- Another parameter can be added to the embed script of Step 14 to the end of the of the
iframetag named&bliAutoInfer. This parameter is optional and it will connect more nodes and edges if it finds that two or more nodes have properties that are in common.
Embed = "<iframe src='https://<hostname>/timbr/embedded/<saved_exploration_name>?token=<token_value>&<property_name>=" & [SelectedValue] & "&bliAutoInfer' style='position: fixed; width:100%; height:100%'></iframe>"
Drag the new variable you created (Embed) into the values field of the HTML Content visual.
Now, you can select a value from the Slicer visual and it will load it in the HTML Content visual.
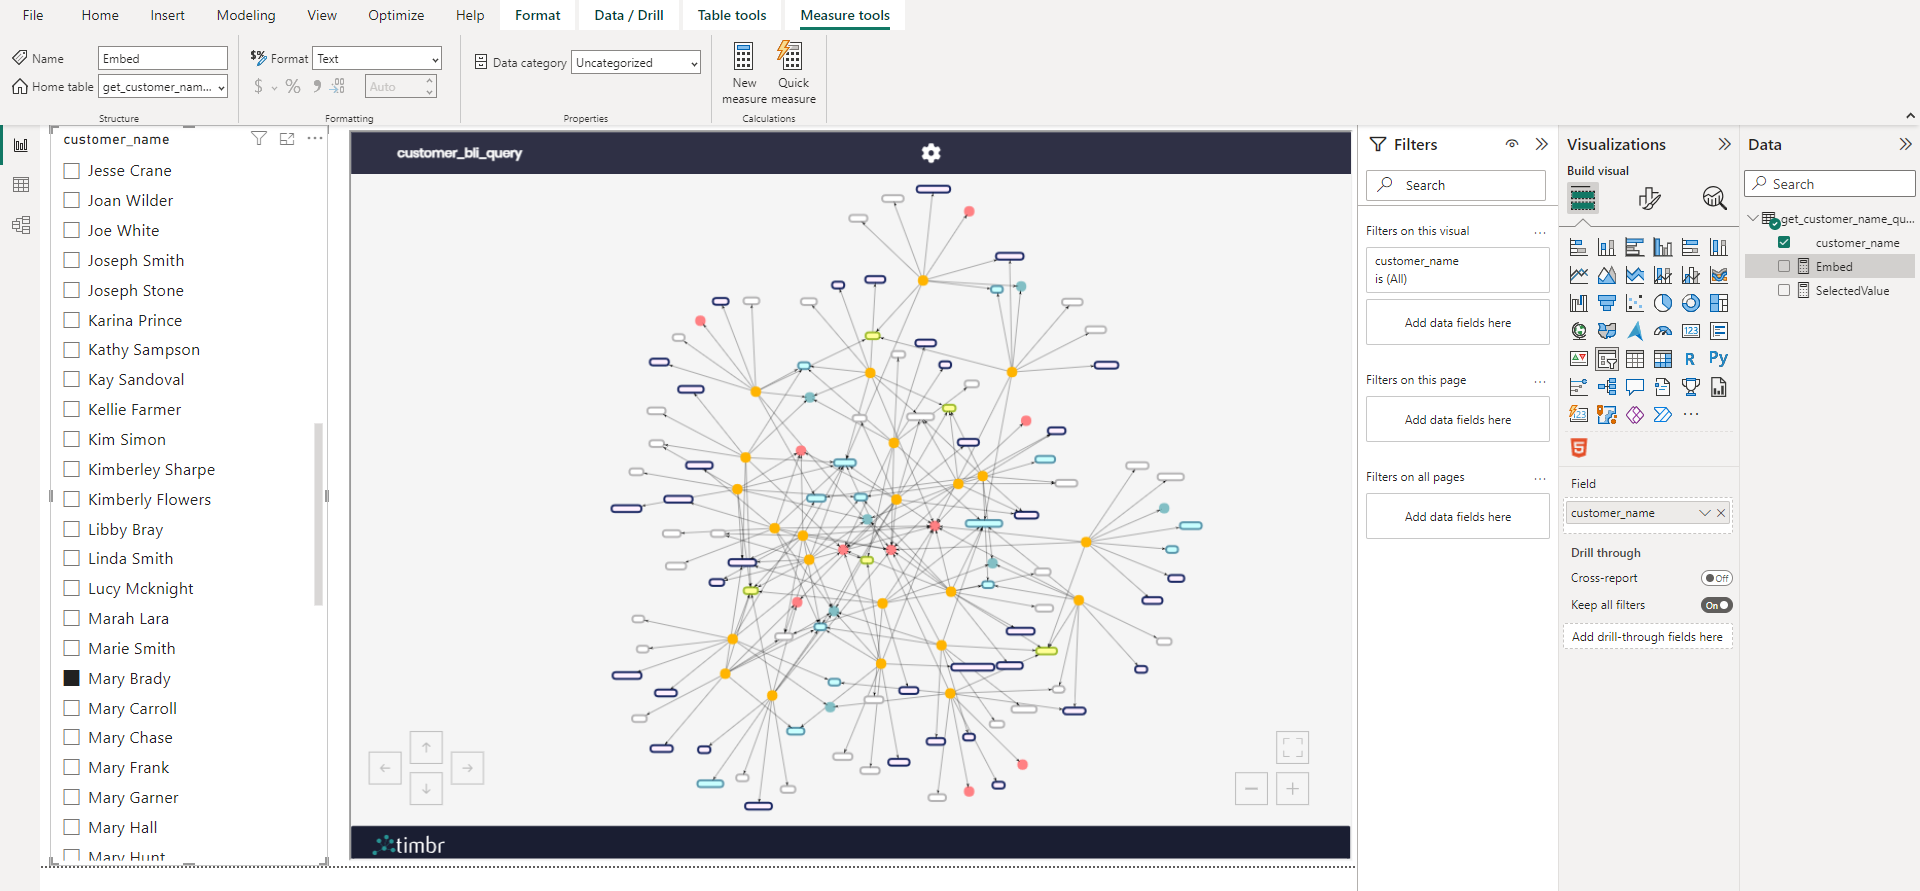
- The end result without the
bliAutoInferparameter will look something like this
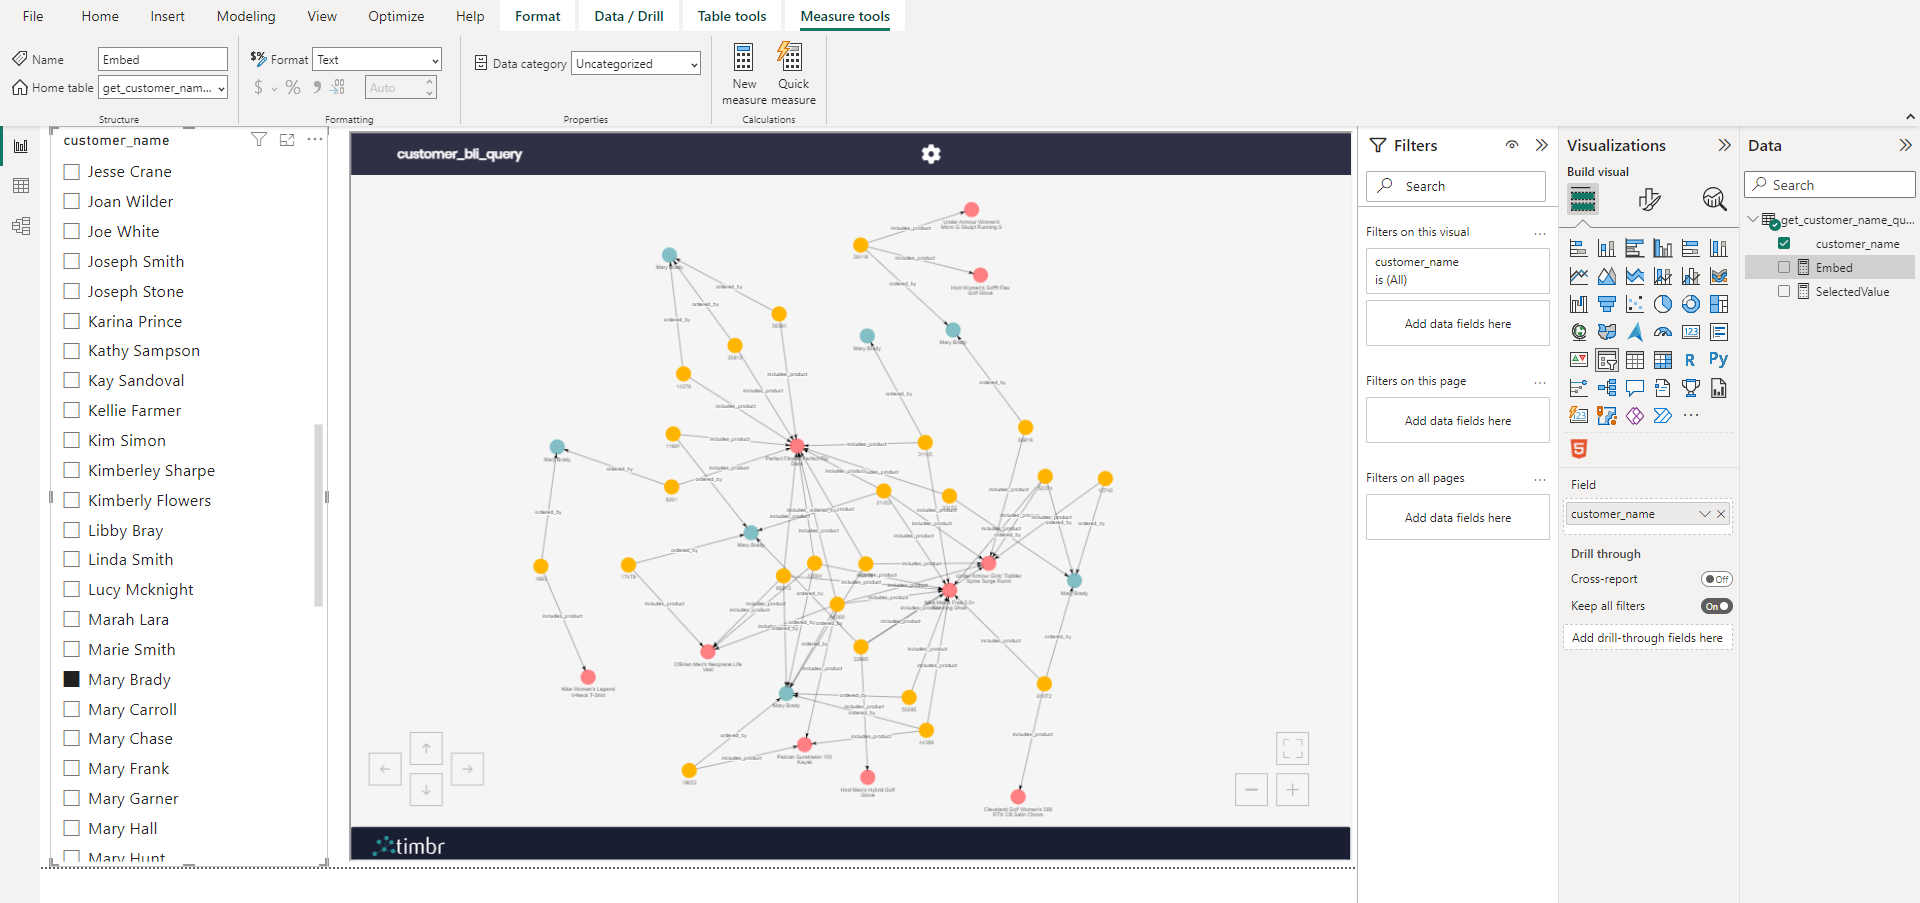
- The end result with the
bliAutoInferparameter will look something like this