Knowledge Lineage
Timbr's Knowledge Lineage component enables users to easily understand data dependencies between the physical data sources and the virtual data model assets.
Users can efficiently perform impact analysis before changing or removing data assets. The Knowledge Lineage component also helps data consumers trust the data and understand where it comes from, what information was integrated from each source, and how the data was used to define the business entities in the semantic knowledge graph.
In the Knowledge Lineage
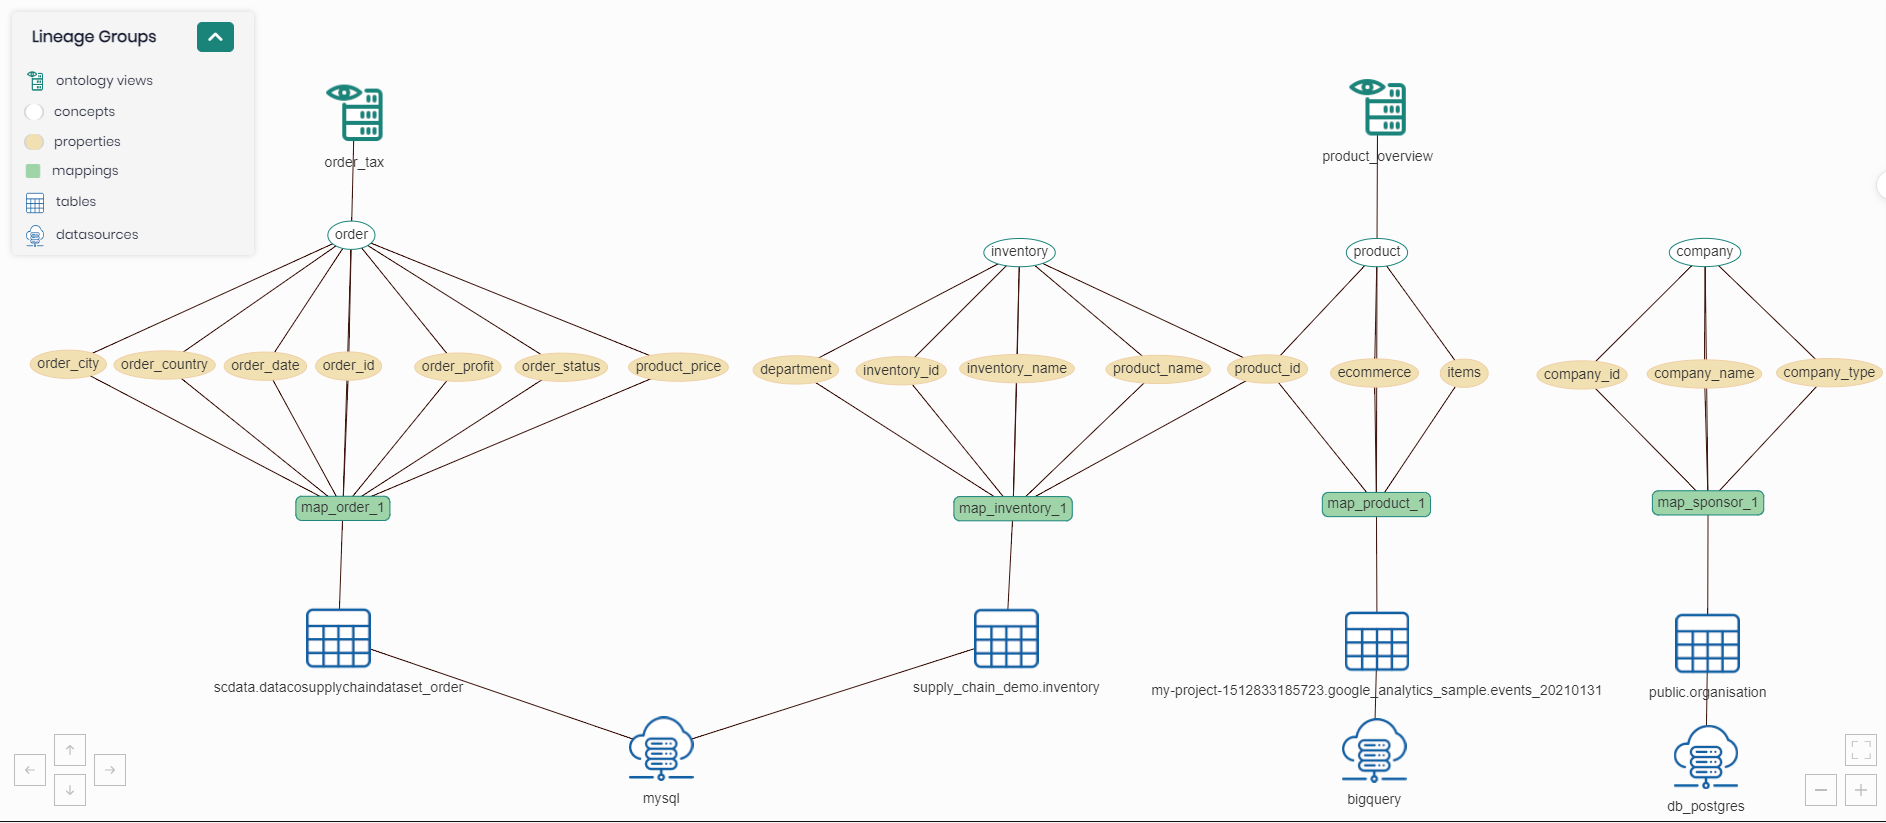
The Knowledge Lineage can be accessed by clicking on the Visualize tab and selecting Knowledge Lineage.
Once Knowledge Lineage is clicked on in the Visualize tab you will be asked to select an existing knowledge graph you wish to load and view. Another option on the top right is to click on Create New Knowledge Graph in order to create a new knowledge graph to load and view.
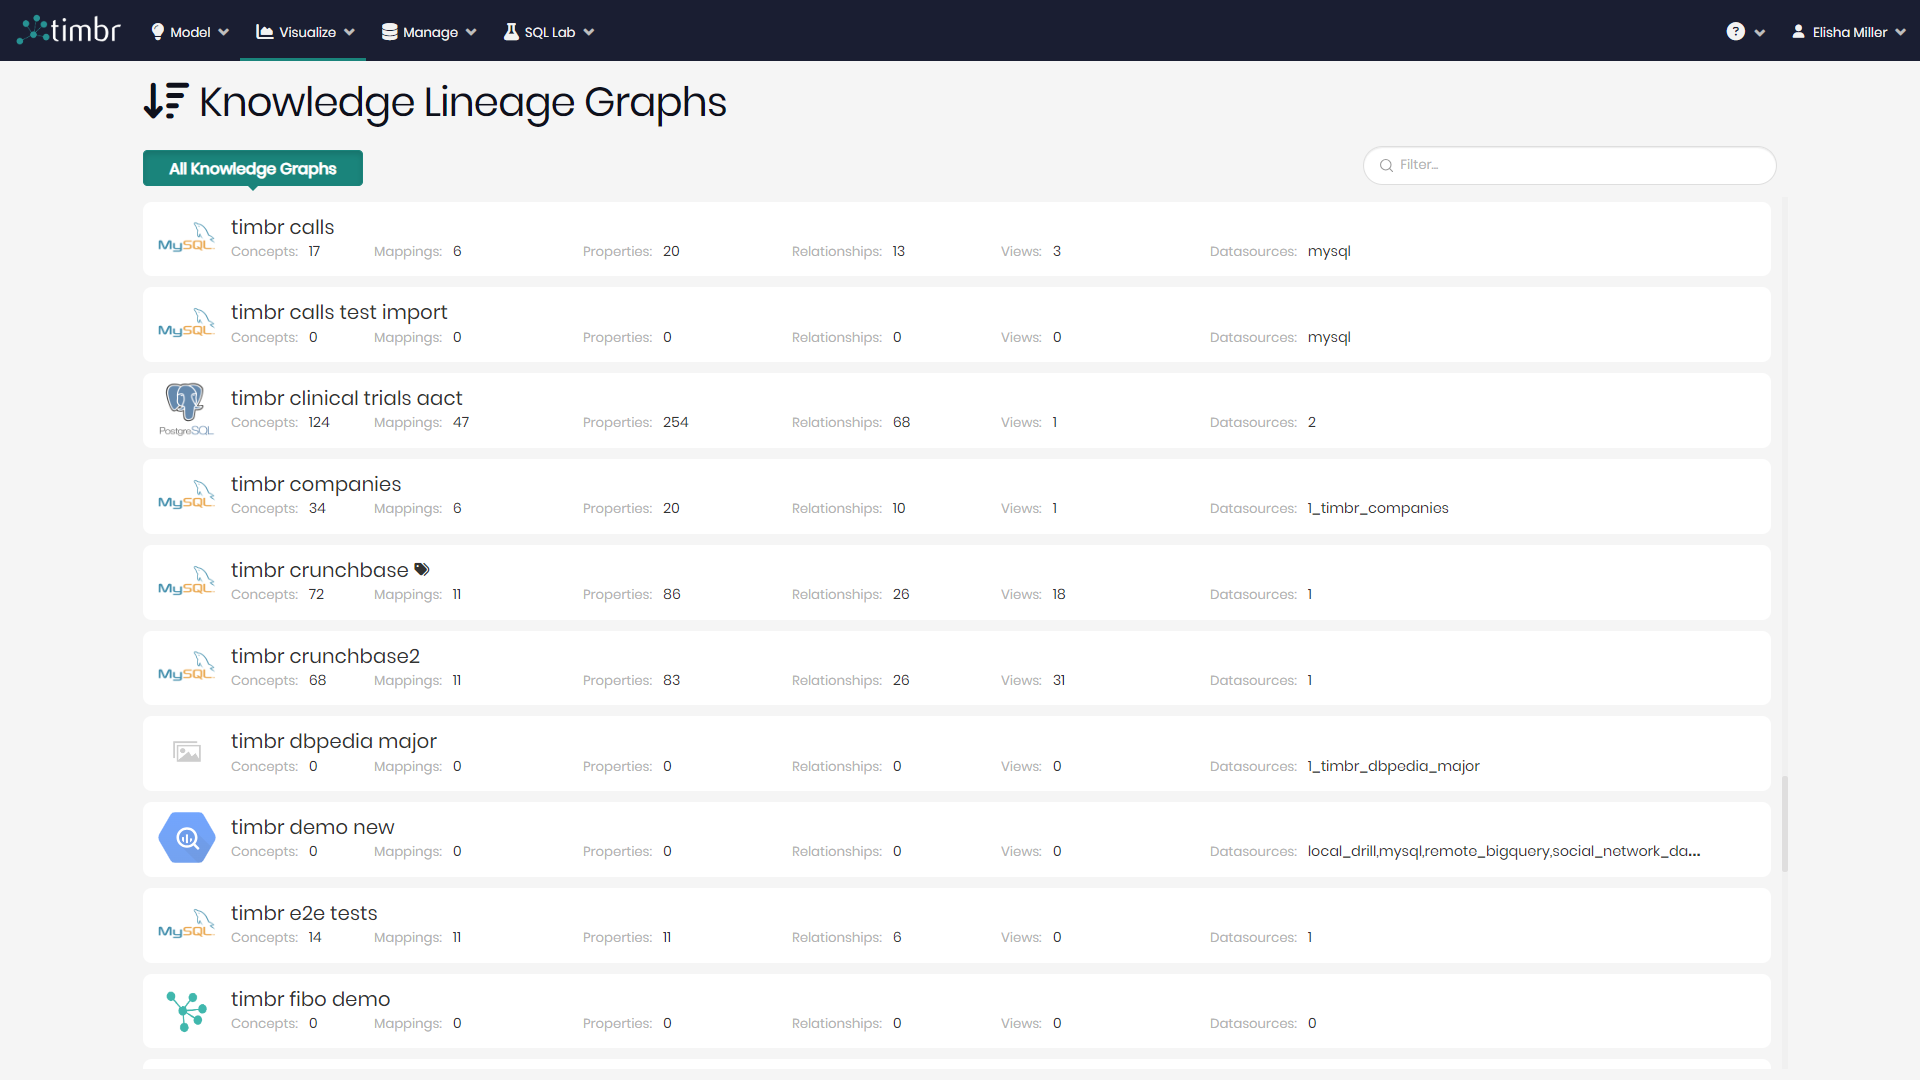
The starting point in the Knowledge Lineage after choosing a Knowledge Graph, is to select an element or multiple elements from the dropdown on the upper part of the screen in order to view them on the graph.
The dropdown includes the following elements:
- Datasources - Datasources that are connected to the Knowledge Graph.
- Tables - Tables from the different datasources connected to the Knowledge Graph.
- Mappings - Data Mappings in the Knowledge Graph.
- Concepts - Business Concepts of the Knowledge Graph.
- Ontology Views - Views associated with the Knowledge Graph.
- Properties - Properties of Business Concepts in the Knowledge Graph.
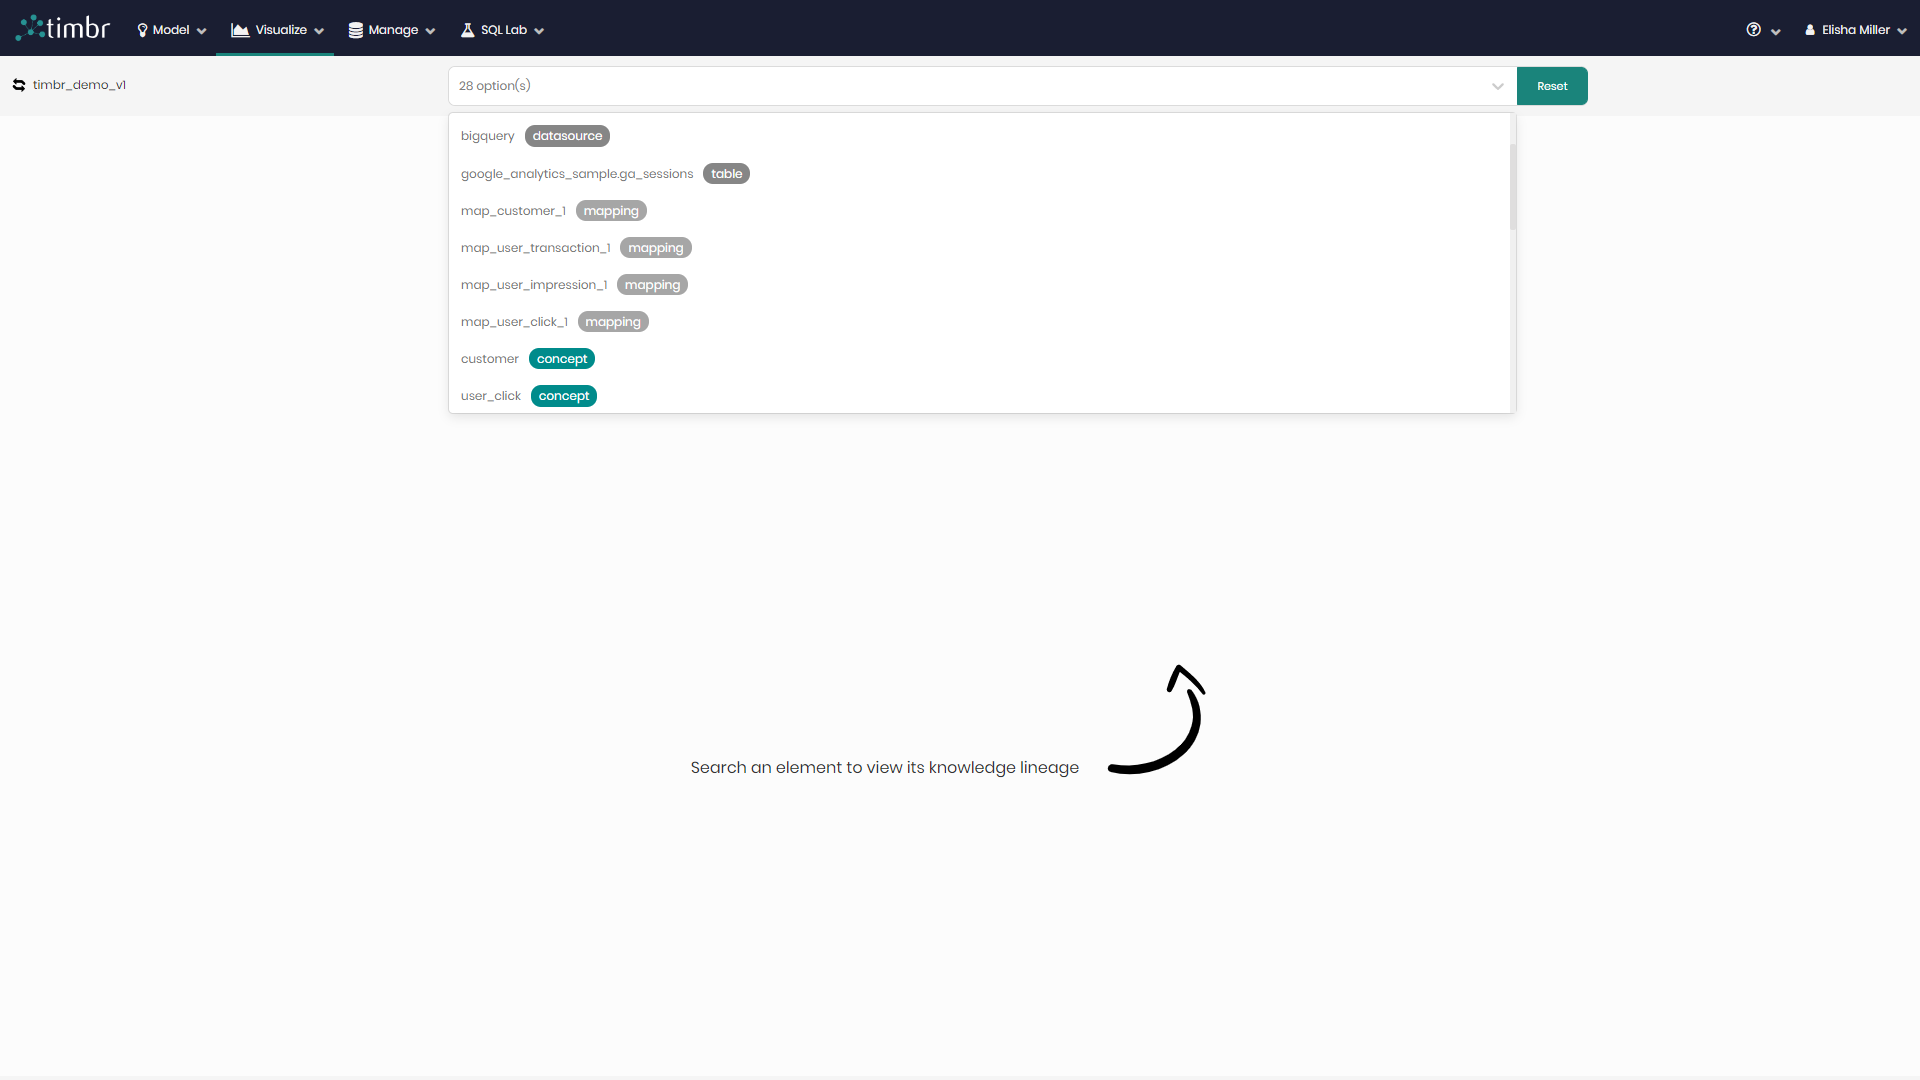
Once the elements are selected GO must be clicked in order to present the elements on the graph. At any point, users can click on the arrows on the top left of the screen and change to any other knowledge graph from the list that pops up.
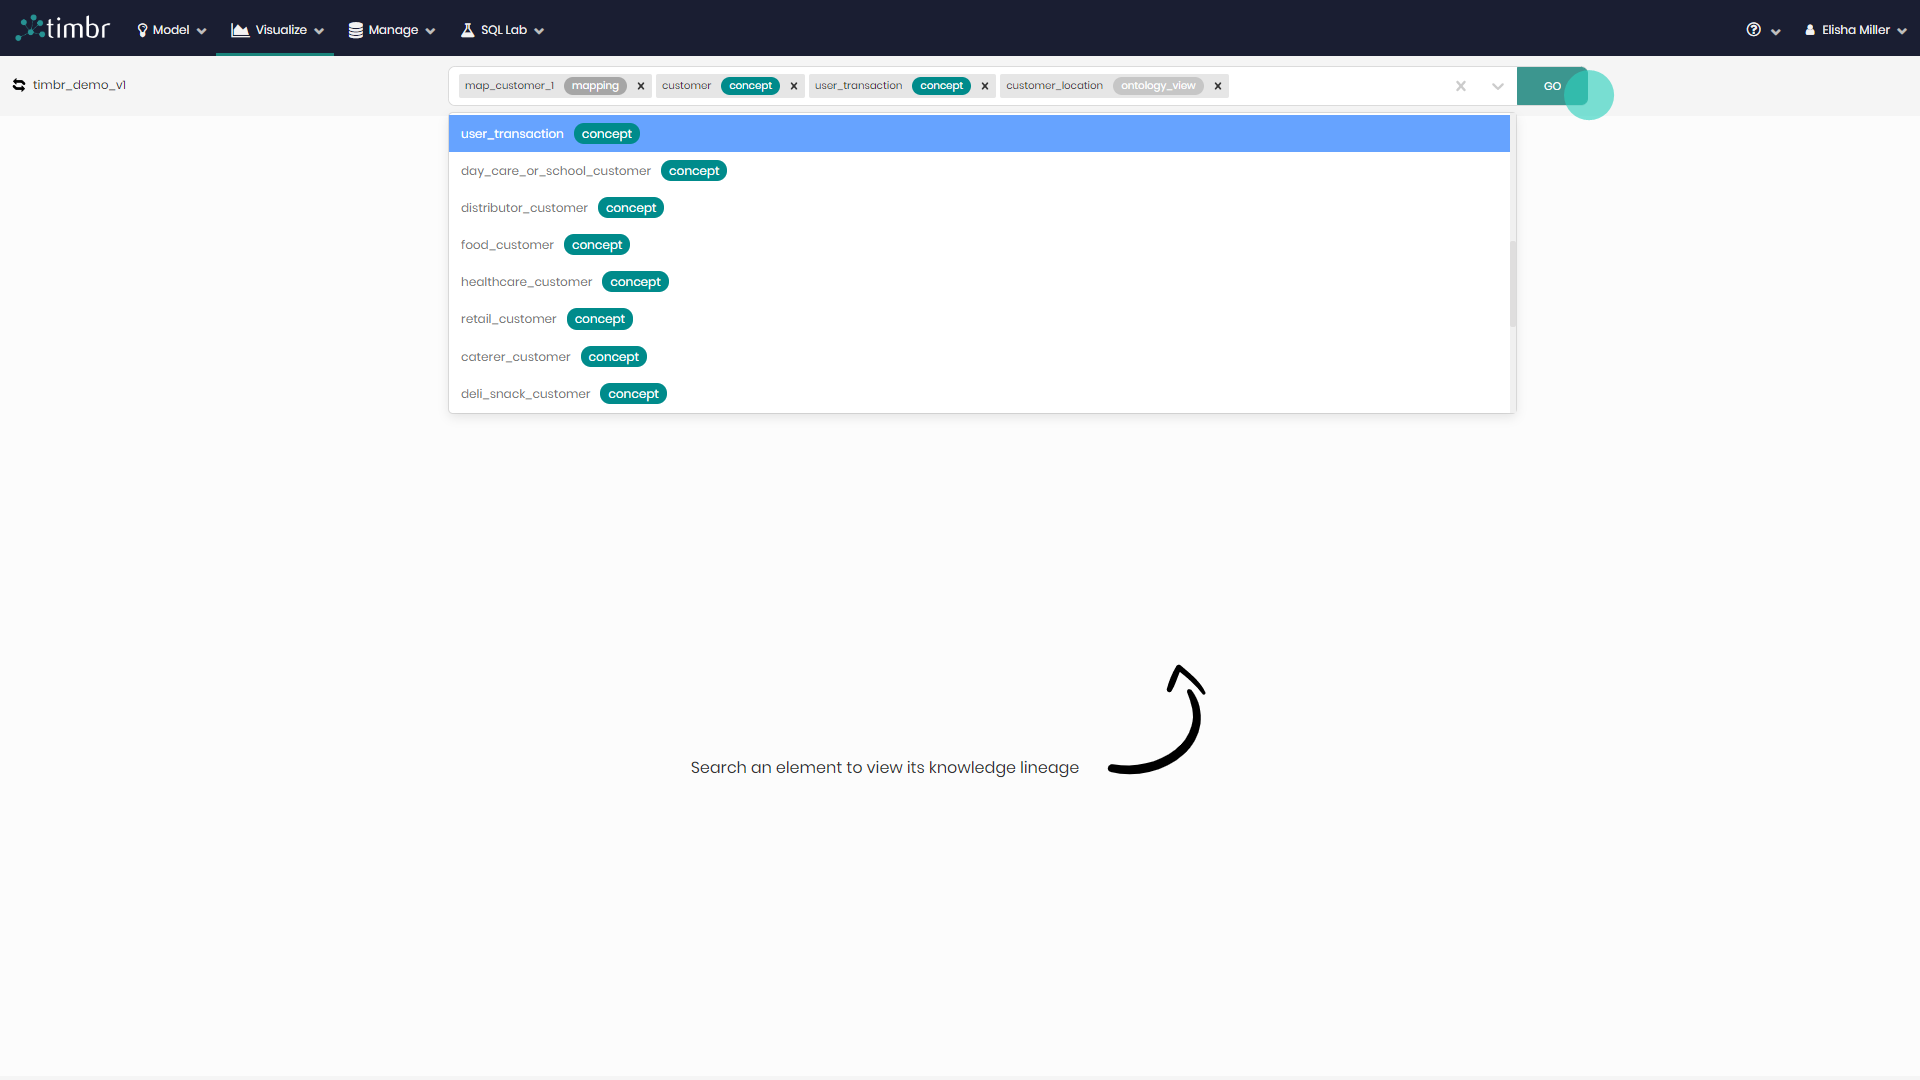
After clicking GO, the selected elements should appear on the graph, each element will appear with its name and type which can be found in the Lineage Group Menu on the top left.
The components of the Knowledge Lineage Graph are as follows:
Main Graph View
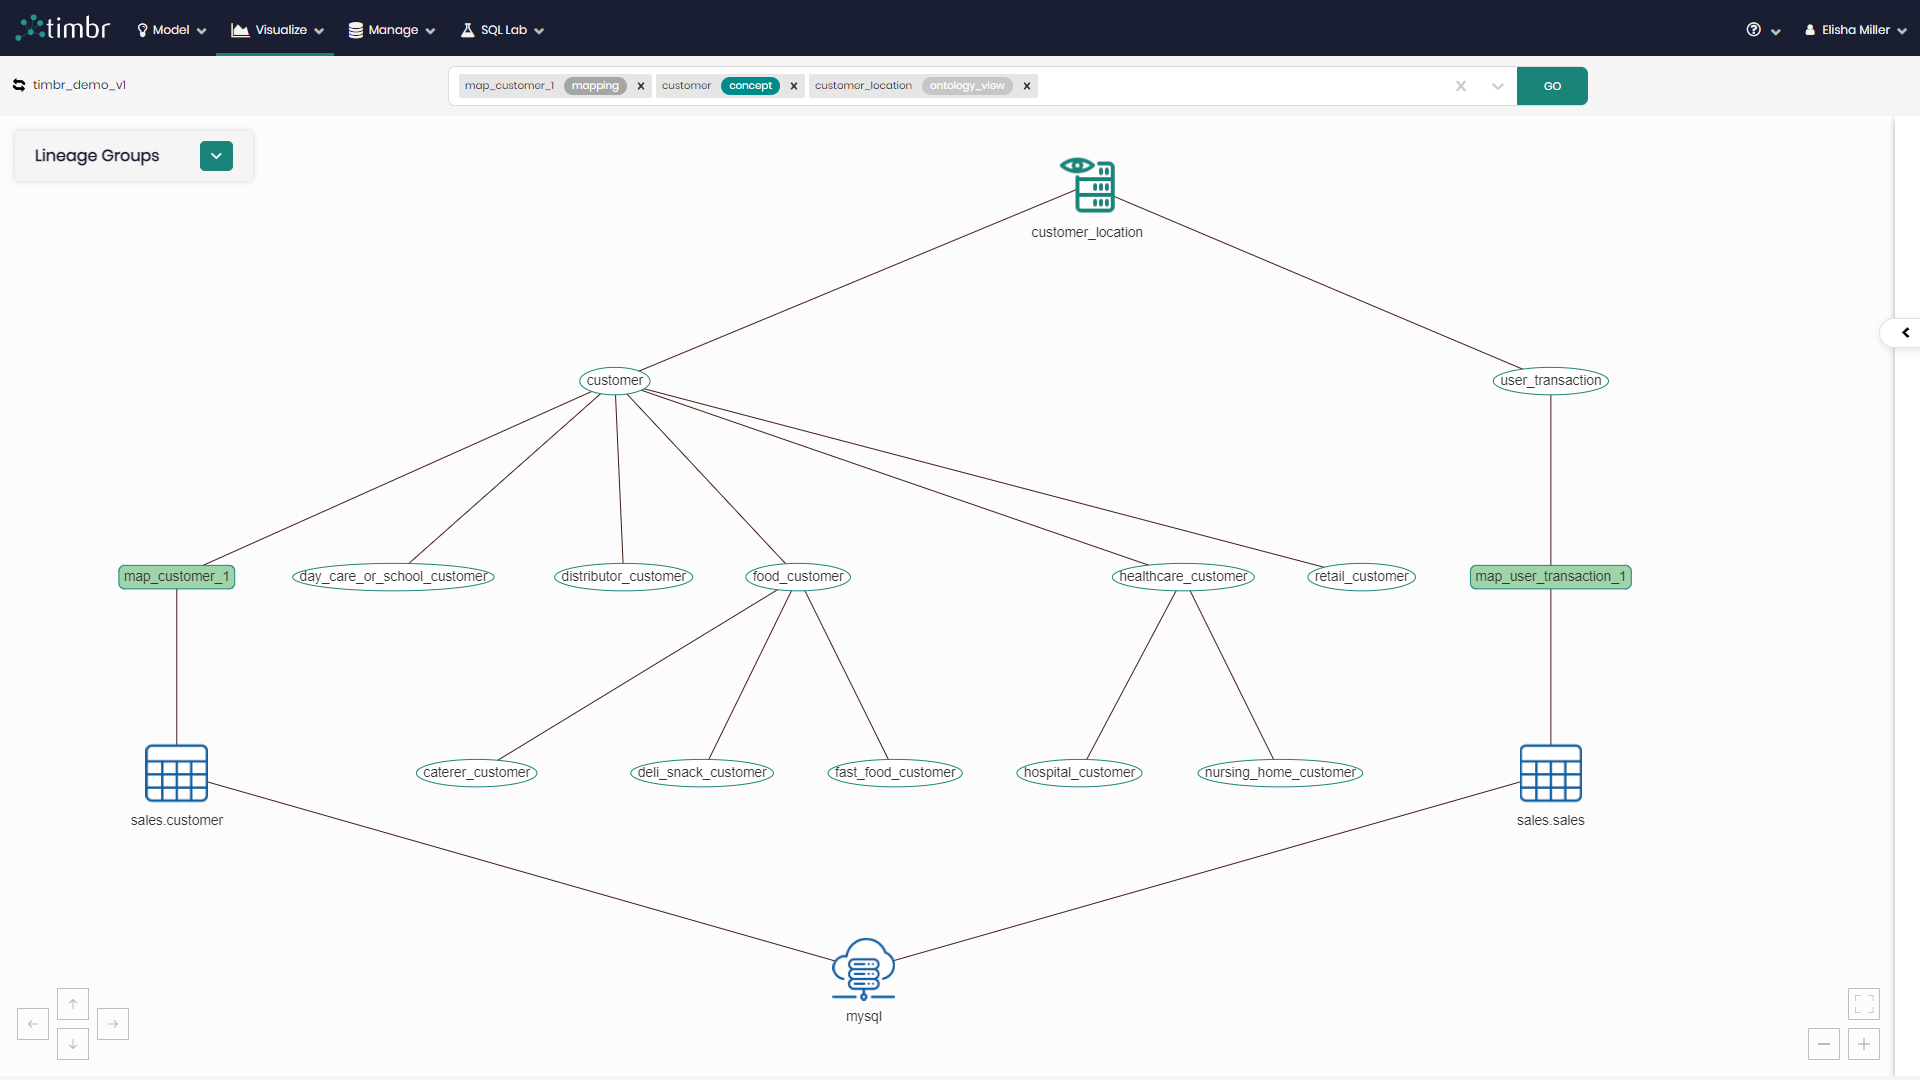
An interactive graph representing the selected elements and their connections. You can zoom-in and zoom-out of the graph view by using the mouse wheel or the + and - buttons on the bottom right, as well as drag the graph and its elements by holding down the mouse or by using the arrows on the bottom left of the screen.
Lineage Group Menu
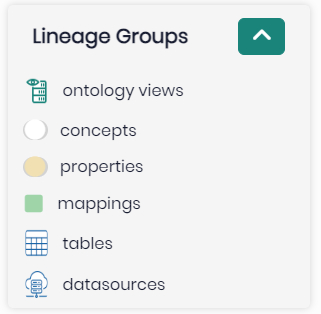
The Lineage Group Menu can be found on the top left of the Knowledge Lineage and contains a list of the chosen and presented elements in the graph.
Each element group is represented by its own icon in order to differentiate it from the rest of the elements on the graph. Any element group can be clicked on in order to hide the selected elements from the graph, and when clicked on again the elements of the group will return to the graph.
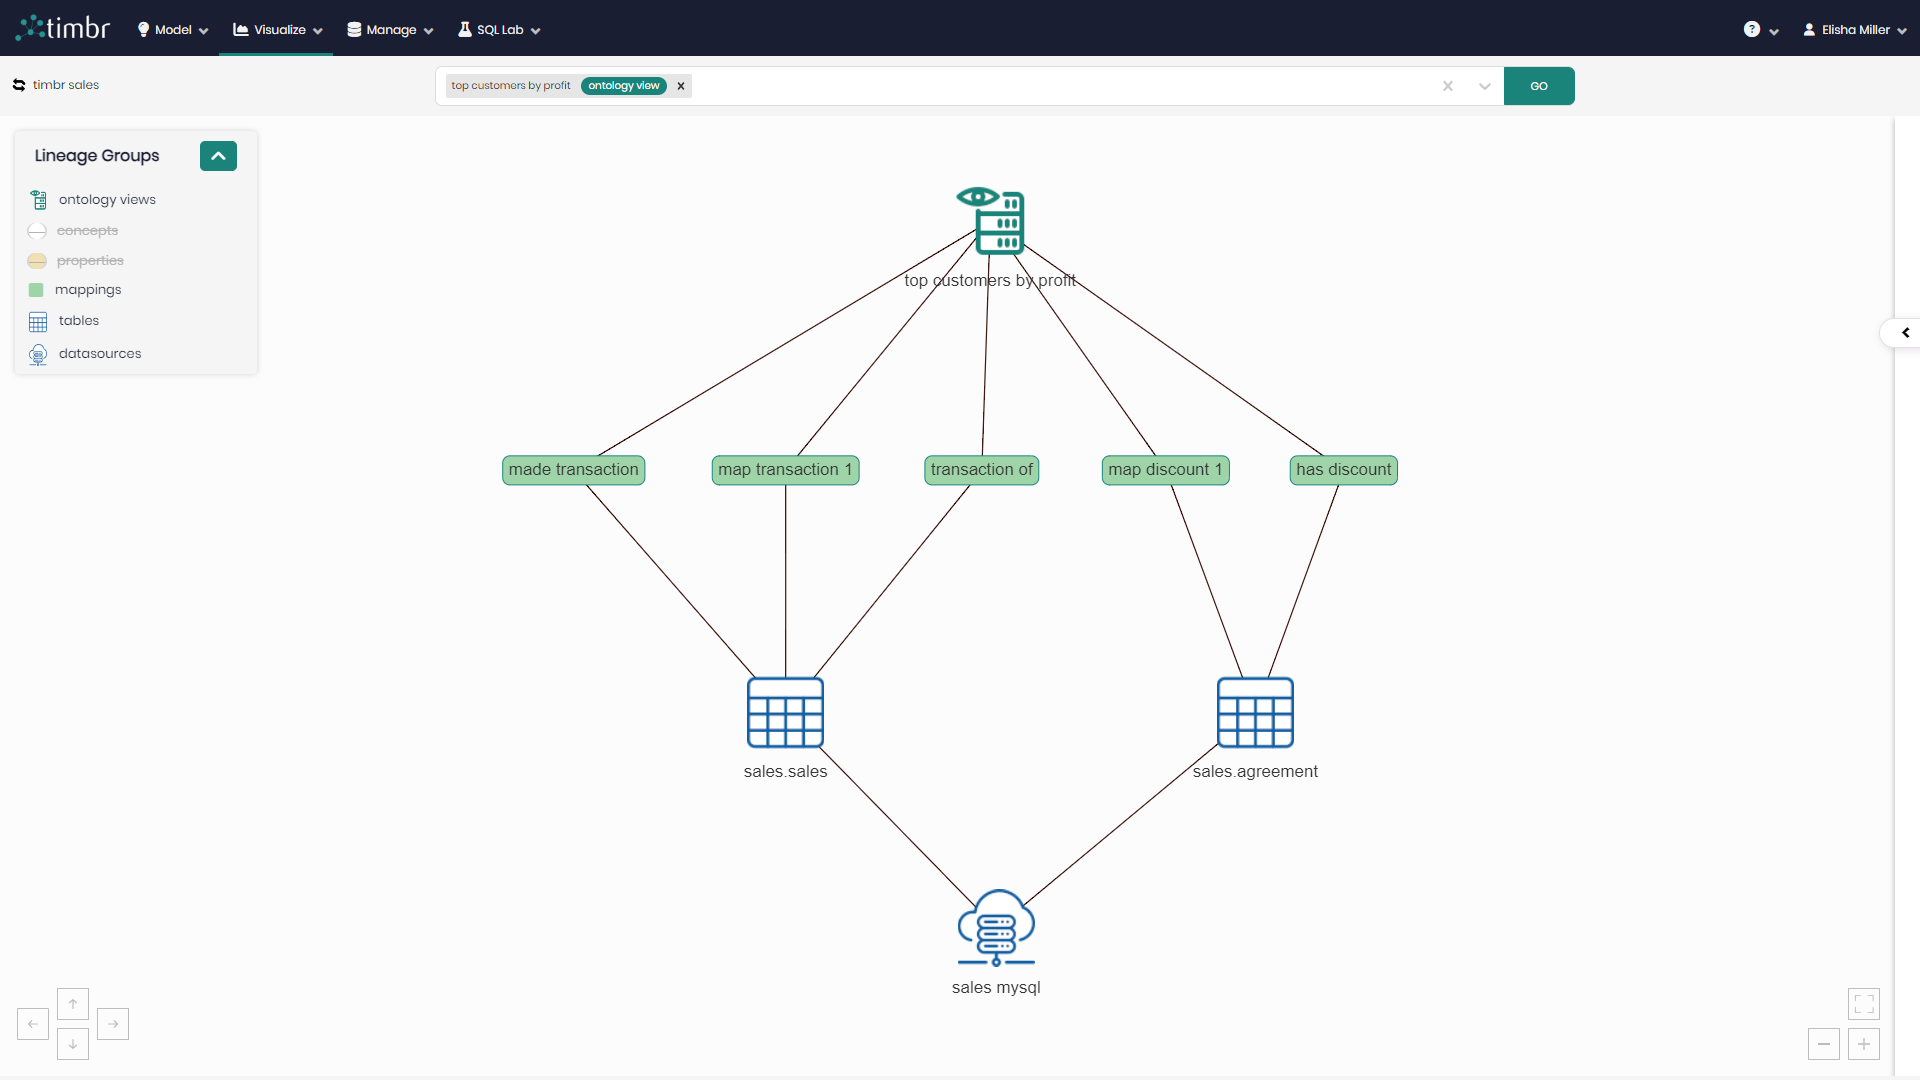
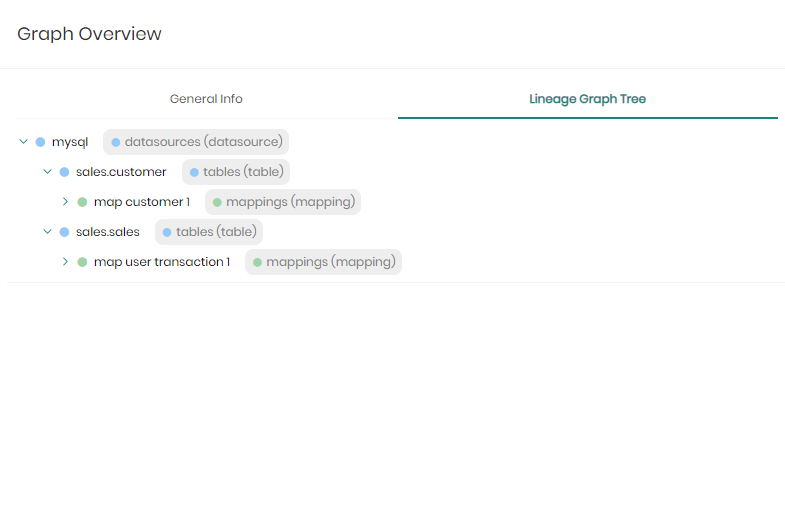
Graph Overview
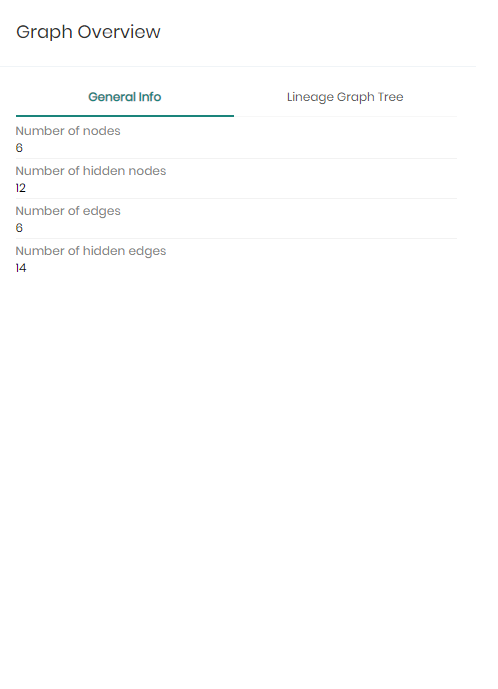
A right-side panel that provides an overview of the graph and its elements. The Graph Overview contains the following two tabs:
General Info - States the Number of nodes that represent the elements, as well as the Number of hidden nodes, Number of edges and Number of hidden edges.
Lineage Graph Tree - Presents the elements on the graph as a tree containing detailed hierarchies.
At any point elements can be added or removed from the drop-down above, Once the changes are made and GO is clicked on, the graph will rearrange itself presenting the new chosen elements.