Timbr and Grafana
This guide explains how to deploy and integrate Timbr’s ontology-based semantic layer with the Grafana monitoring stack.
Timbr operates as a virtual knowledge graph over existing data sources, enabling the semantic layer to expose business entities, relationships, and logic that can be monitored and visualized through Grafana dashboards.
By combining Timbr and Grafana, organizations can gain visibility into both system performance and the semantic layer powering SQL queries, BI tools, and AI systems.
Install and Run Timbr + Grafana Stack
- Download the timbr-grafana-stack file from the URL provided by Timbr.
- Transfer the file to your Linux VM.
- Untar the downloaded file using this command:
tar -xvzf timbr-grafana-stack.tar.gz - Move to the new folder using this command:
cd timbr-grafana-stack - Run the preinstall script using this command:
./preinstall-grafana-stack.sh
Running the command above will erase the existing data in Grafana
- Run the services using this command:
./run_timbr_grafana_stack.sh
Configure Grafana
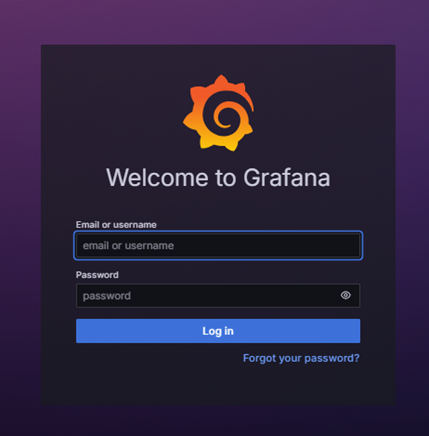
Open your browser and type in the URL the IP address of your machine with port
3000using the pattern<IP address>:<requested port>For example:192.168.1.1:3000Enter the credentials on the Grafana login page
- Default username:
admin - Default password:
admin
- Default username:
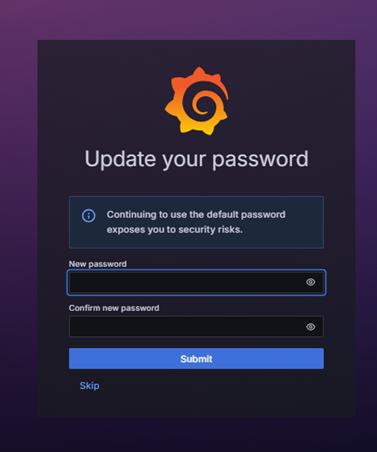
For security reasons, change the admin default password after first login
In the left side panel choose Dashboards
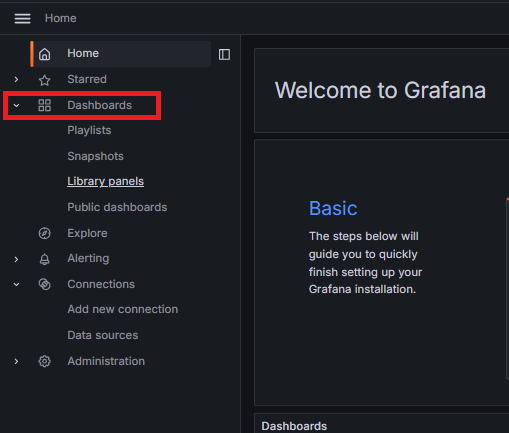
Click on the Create Dashboard

Click on Import dashboard
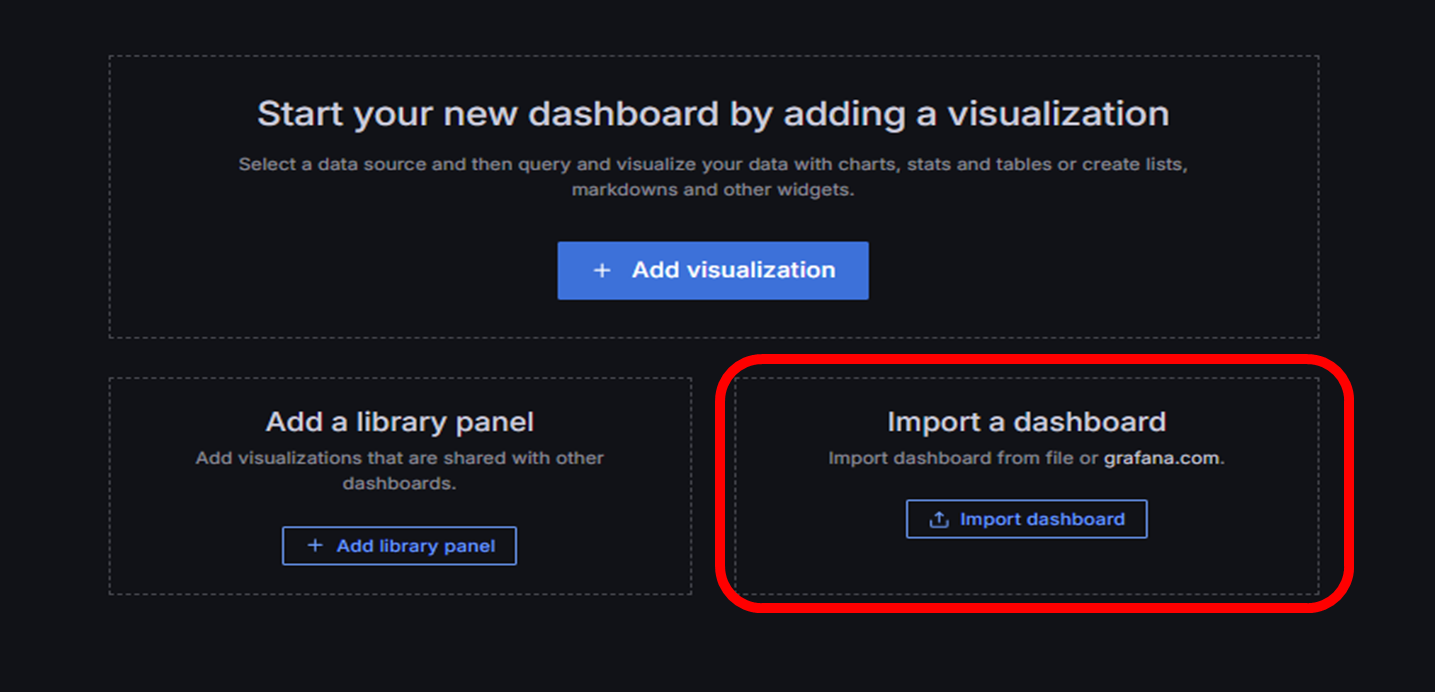
Now you can choose one of the ways to load the default monitoring dashboards
6.1. Upload the JSON file included in the timbr-grafana-stack file located in:
grafana-defaults/provisioning/dashboards/docker_and_system_monitoring.json6.2. Open the downloaded file
docker_and_system_monitoring.jsonand copy-paste the code in the lower box and click on the Load button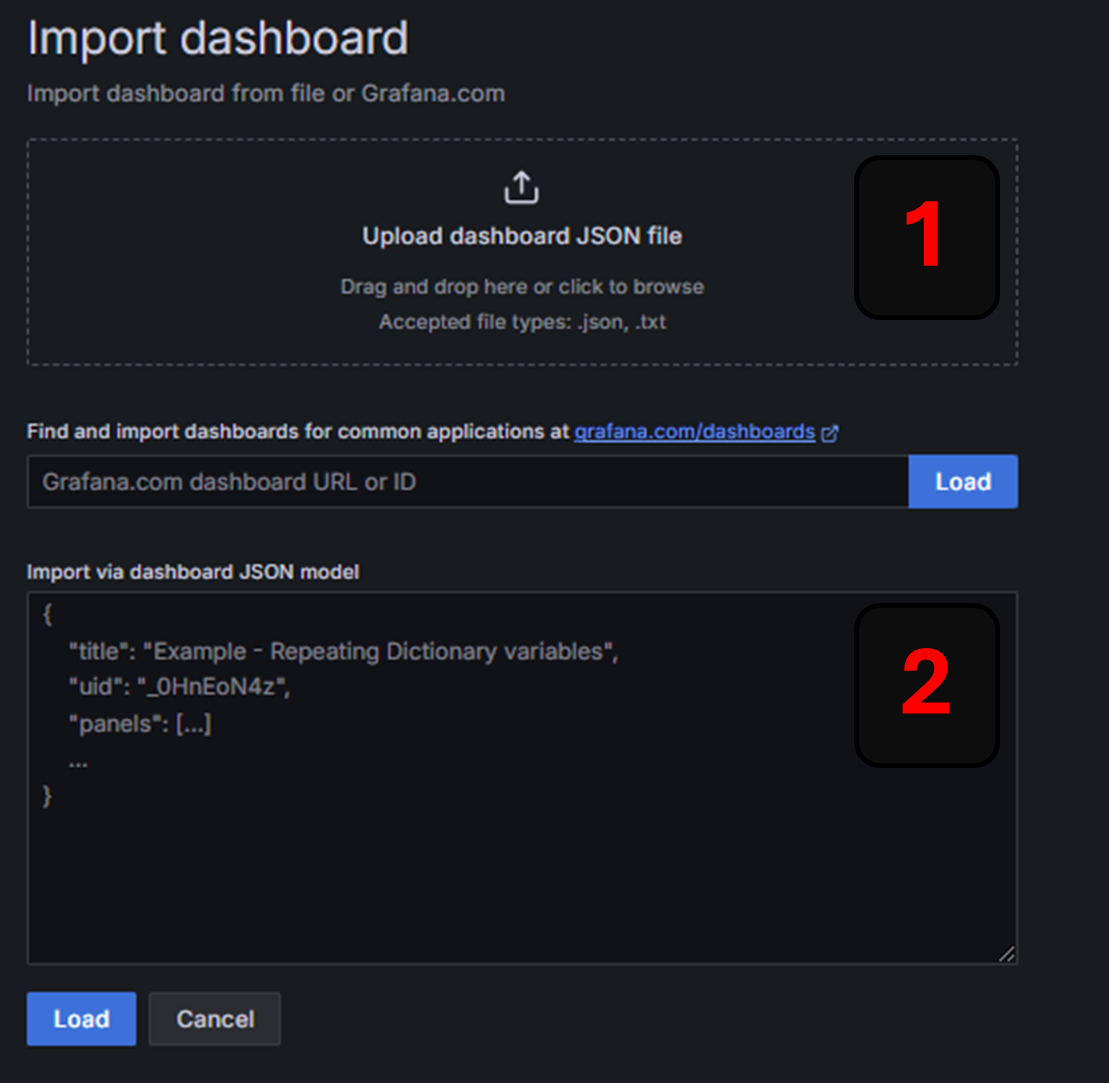
Select the
Timbr-Prometheusoption and then click on the Import button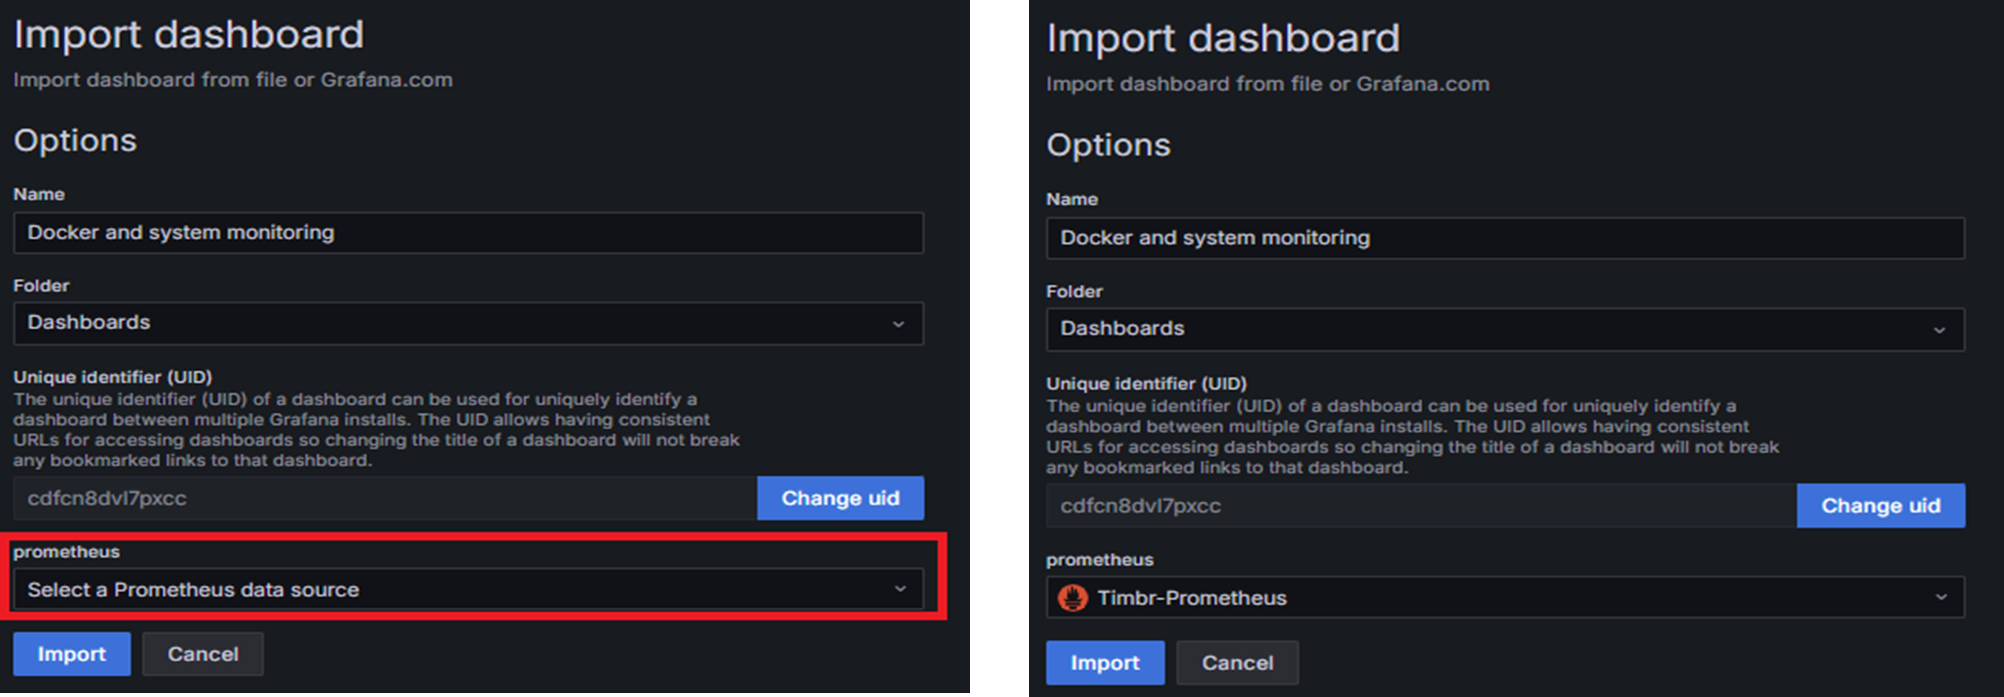
Update only Timbr Version
Change directory to the timbr-grafana-stack folder by running the command:
cd timbr-grafana-stackUpdate the Timbr version by running this command:
./update_timbr_version.sh
Update Timbr and Grafana Stack
Change directory to the timbr-grafana-stack folder by running the command:
cd timbr-grafana-stackUpdate the Timbr version and Grafana stack script by running this command:
./update_timbr_grafana_stack.sh
Restart Timbr Services
Change directory to timbr-grafana-stack folder by running the command:
cd timbr-grafana-stackRestart the Timbr services by running this command:
./restart_timbr.sh