MDX (Multidimensional Expressions)
Timbr enables users to connect to its MDX (Multidimensional Expressions) Endpoint, allowing seamless integration with Microsoft Excel for working with OLAP cubes from the semantic model. Using the MDX endpoint, you can load business concepts as OLAP cubes, customize them, and enhance pivot tables with additional configurations, such as hierarchies.
Connecting to Timbr MDX Endpoint from Microsoft Excel
Step 1: Open Excel and Access the Data Connector
- Open Microsoft Excel.
- Go to the Data ribbon.
- Click on Get Data > From Database > From Analysis Services.

Step 2: Enter the MDX Endpoint Details
- In the pop-up window, enter your Timbr environment URL with
/MDXappended.- Example:
https://your-timbr-environment-url/MDX
- Example:
- For the Username, enter the token prefix and the data model name:
token@<model-name>.- Example:
token@Supply_Metrics
- Example:
- For the Password, paste the token found in your Timbr environment.
- Click Next to proceed.

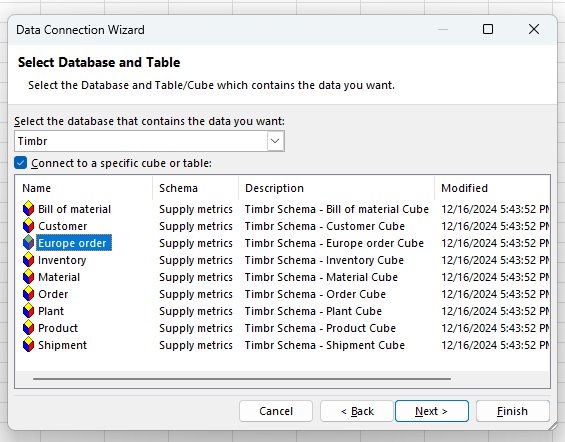
Step 3: Select a Concept to Load as a Cube
- Once connected, Excel will display the available concepts from your semantic model.
- Select the desired concept to load as an OLAP cube (e.g., Order).
- Click Finish.

Step 4: Create and Customize a Pivot Table
- Excel will prompt you to create a pivot table.
- In the PivotTable Fields to the right, drag and drop the properties and measures of the selected concept to build your table.
Notice that related concepts and their properties are also accessible through relationships, allowing you to combine data seamlessly.

Additional Configurations
Timbr provides additional configurations using tags to enhance your pivot tables and tailor the MDX experience. Tags allow you to:
- Create Hierarchies: Define levels for easier navigation and analysis.
- Control Concept Visibility: Expose lower-level concepts in MDX that are hidden by default.
- Adjust Property Visibility: Make hidden dimensions and measures, such as numerical fields or IDs, available in pivot tables.
- Customize Labels: Assign user-friendly labels to concepts or properties for better clarity in MDX.
Creating Hierarchies Using Tags
A hierarchy is a set of members organized into a structure for convenient analysis. For example, a store hierarchy consists of levels such as store name, city, state, and nation. This structure allows for intermediate sub-totals, such as a state total aggregating city totals, which in turn aggregate store totals.
In this example, we will create two hierarchies: Location Hierarchy and Product Hierarchy.
Step 1: Add a Location Hierarchy Tag
- Go to your Timbr environment and access your data model in the Ontology Explorer.
- Click on Manage Ontology Tags in the top-right corner.
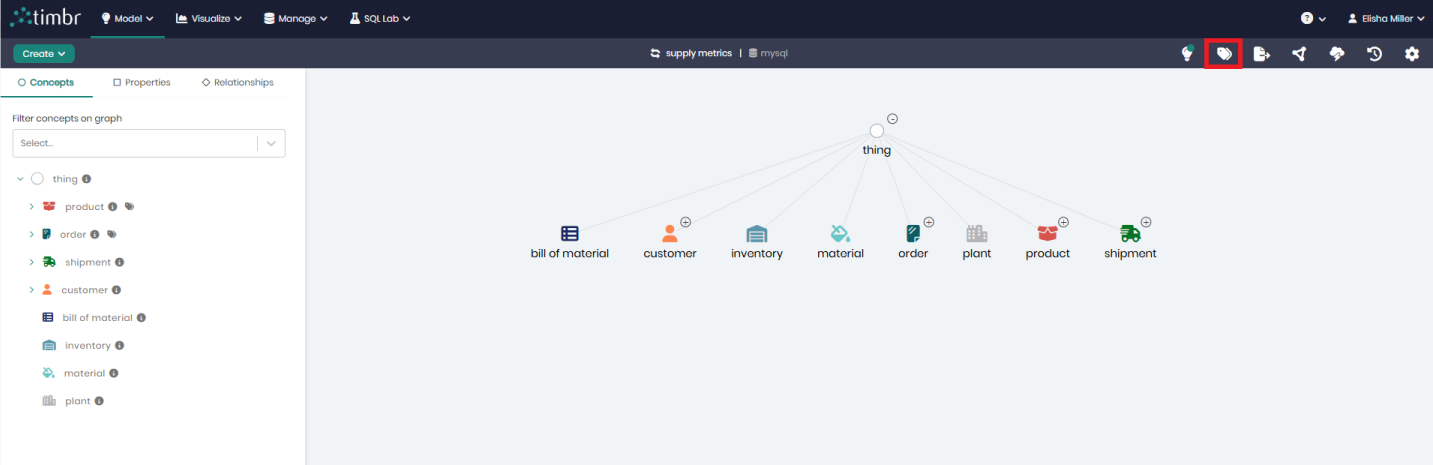
- Click Add New Tag.

- Fill in the tag details:
- Target Type: Concept
- Target Entity: Your desired Concept
- Tag Name:
- Use
mdx.hierarchy.<name>for MDX-specific hierarchies. - Use
hierarchy.<name>for hierarchies that apply across all tools.
- Use
- Value:
The properties you'd like to add from your chosen concept, separated by commas without spaces.
Example for MDX-only:
 Target Type: Concept
 Target Entity: Order
 Tag Name: mdx.hierarchy.location
 Value: market,order_region,order_country,order_city
Example for all tools:
  Target Type: Concept
  Target Entity: Order
  Tag Name: hierarchy.location
  Value: market,order_region,order_country,order_city
- Save the tag.

Step 2: Add a Product Hierarchy Tag
- Follow the same steps as above.
- Set the tag details for the Product Hierarchy:
- Target Type:
Concept - Target Entity:
Product - Tag Name:
mdx.hierarchy.product - Value:
department,category,product_name
- Target Type:
- Save the tag.

Step 3: Refresh Excel to Apply Hierarchies
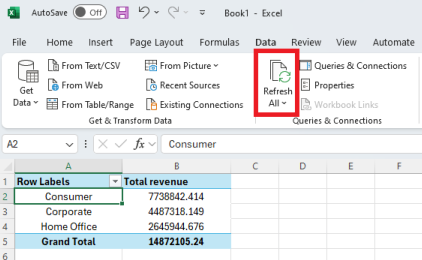
- Return to Microsoft Excel.
- In the Data ribbon, click Refresh.
- You will now see the new hierarchies in the metadata of the PivotTable Fields.

Step 4: Use the Hierarchies in Pivot Tables
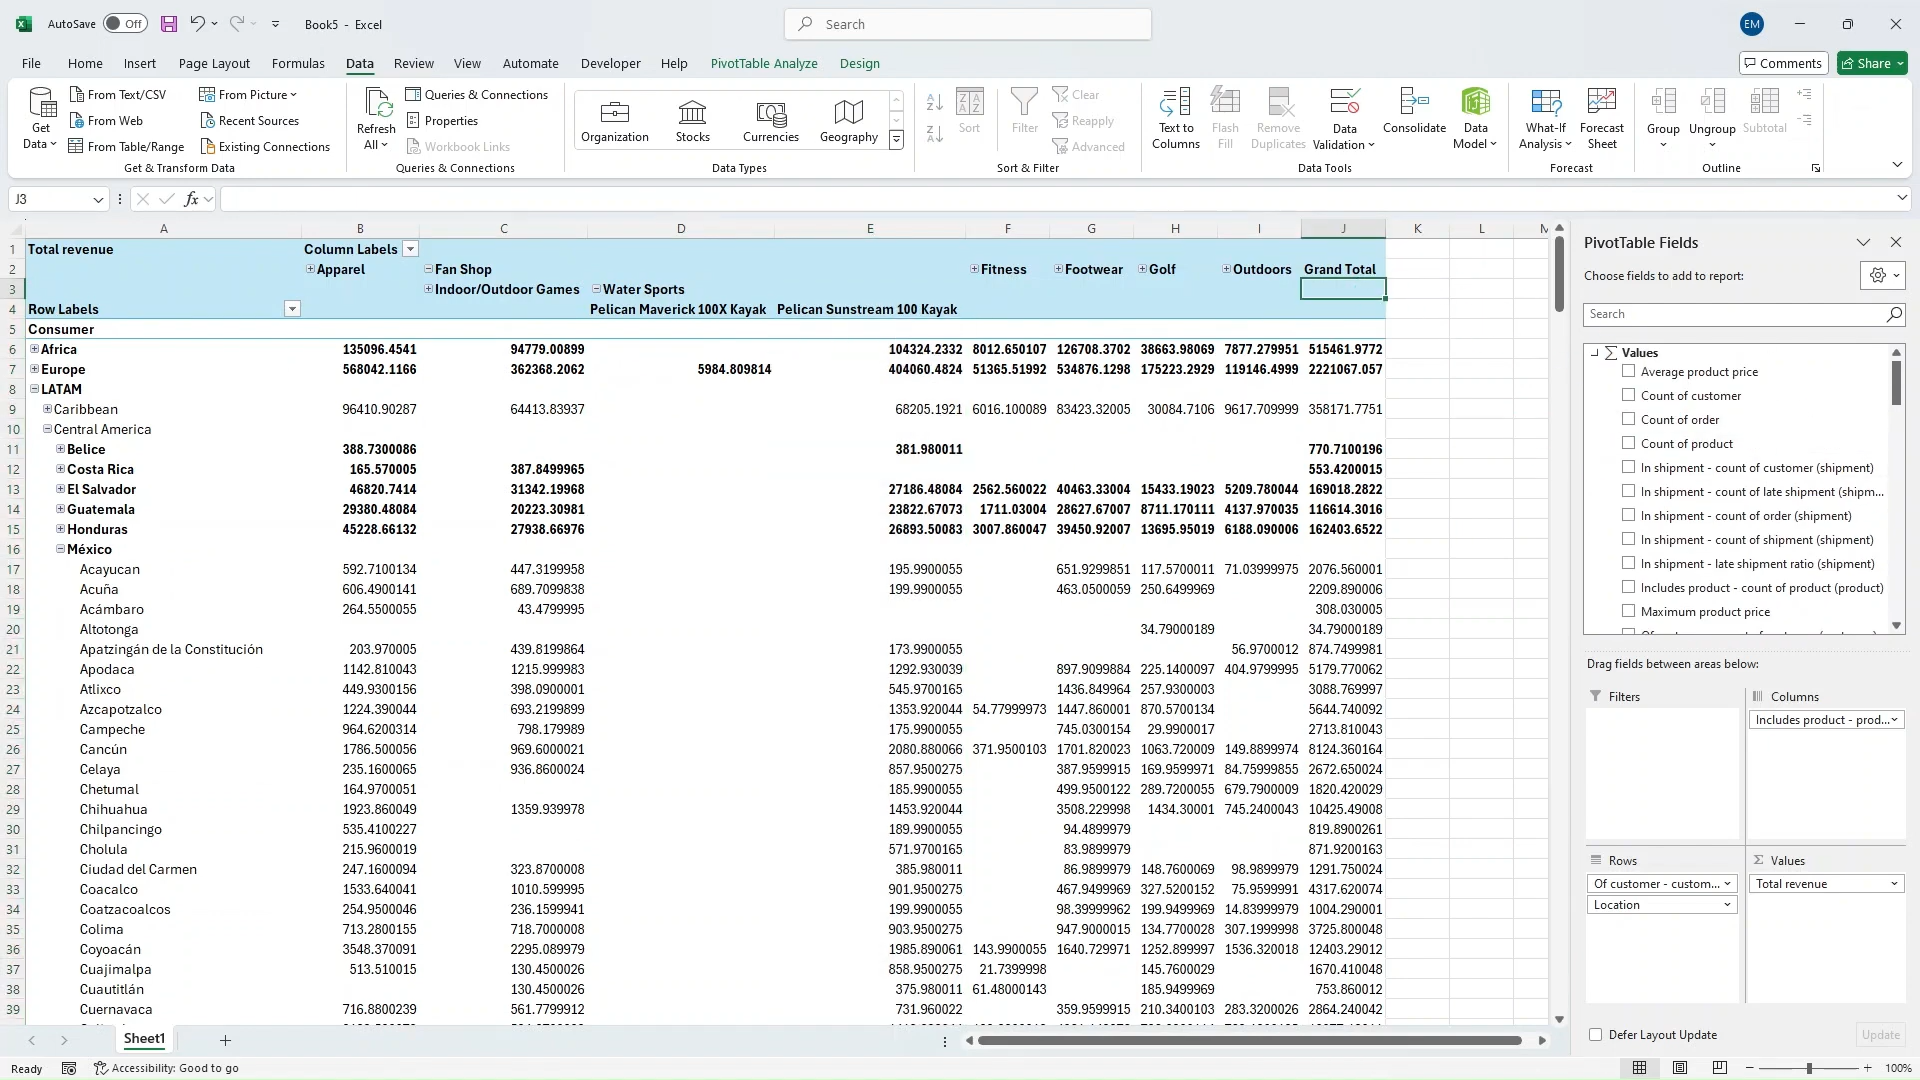
- Drag and drop the new hierarchies (e.g., Location and Product) into your pivot table.
- Drill down through the levels:
- Location: Market > Region > Country > City
- Product: Department > Category > Product Name
- Analyze and customize the pivot table as needed.
If you make changes in Timbr (e.g., adding hierarchy tags), remember to click Refresh in the Data ribbon in Excel to update the available metadata.
Failing to refresh may result in discrepancies and prevent newly added concepts, properties, and relationships from appearing, as the tags will not take effect.
Configuring Concept Visibility Using Tags
By default, Timbr only displays top-level concepts (those inheriting directly from thing) in MDX. Concept Visibility allows you to expose lower-level concepts that are hidden by default, ensuring they are available for use in Excel.
Steps to Set Concept Visibility:
1. Access the Ontology Tags:
- Go to your Timbr environment and open your data model in the Ontology Explorer.
- Click on Manage Ontology Tags in the top-right corner.
2. Add a New Tag:
- Click Add New Tag.
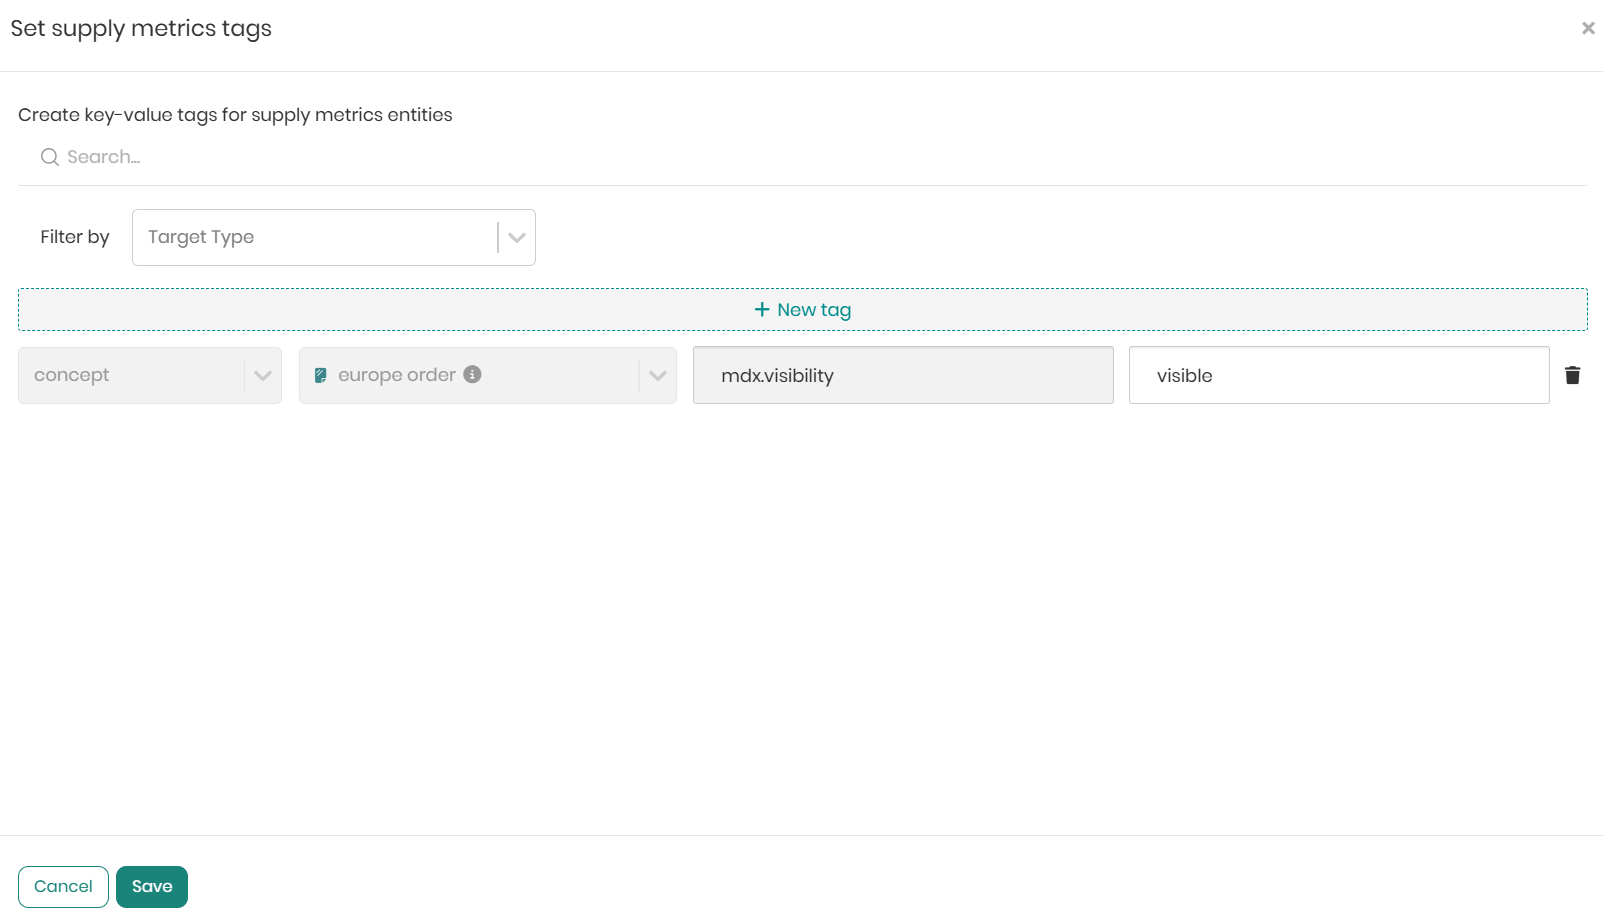
3. Configure the Tag Details:
- Target Type: Concept
- Target Entity: Select the lower level concept you want to expose (e.g., Europe Order).
- Tag Name:
- Use
mdx.visibility(for MDX only) orvisibility(for all tools).
- Use
- Value: visible
Example for MDX-only:
 Target Type: Concept
 Target Entity: Europe Order
 Tag Name: mdx.visibility
 Value: visible
Example for all tools:
  Target Type: Concept
  Target Entity: Europe Order
  Tag Name: visibility
  Value: visible
In addition to visible, you can also use the value hidden to hide top-level concepts that are displayed by default.
4. Save the tag.
5. Connect in Microsoft Excel:
- Open Microsoft Excel.
- Go to the Data ribbon.
- Click on Get Data > From Database > From Analysis Services to connect to the database.
- In the pop-up window, enter the following credentials:
- Server Name: Your Timbr environment URL with
/MDXappended.- Example:
https://your-timbr-environment-url/MDX
- Example:
- Username:
token@<model-name>- Example:
token@Supply_Metrics
- Example:
- Password: Paste your Timbr access token.
- Click Next to proceed.
- Server Name: Your Timbr environment URL with
For detailed instructions on entering credentials, refer to the Connecting to Timbr MDX Endpoint from Microsoft Excel section above.
6. Select a Lower-Level Concept as a Cube
- Once connected, Excel will display the available concepts from your semantic model.
- Select your lower level concept to load as an OLAP cube (e.g., Europe Order).
- Click Finish to proceed.
7. Customize Your PivotTable
- Excel will prompt you to create a PivotTable.
- In the PivotTable Fields pane, you will see:
- The selected concept's properties and measures.
- Any related concepts accessible through relationships.
- Drag and drop properties and measures into the Rows, Columns, or Values areas to analyze data seamlessly. The PivotTable will include only the data relevant to the selected lower-level concept, ensuring precise and focused analysis.
If you make changes in Timbr (e.g., adding visibility tags), remember to click Refresh in the Data ribbon in Excel to update the available metadata.
Failing to refresh may result in discrepancies and prevent newly added concepts, properties, and relationships from appearing, as the tags will not take effect.
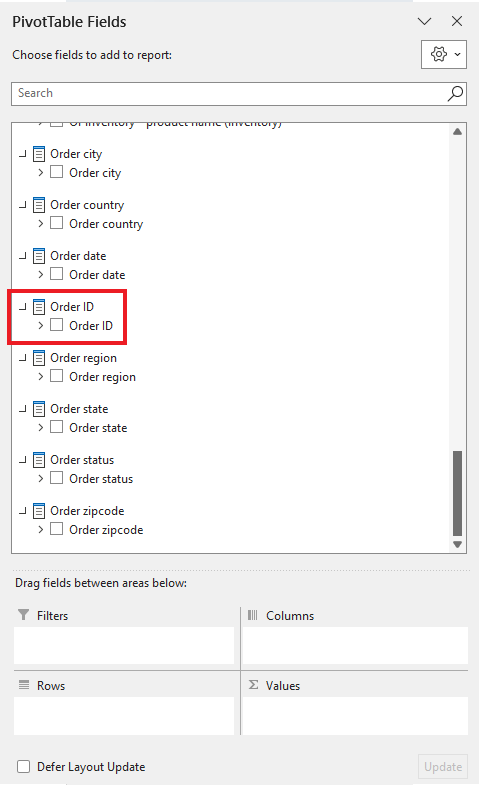
Configuring Property Visibility Using Tags
By default, certain properties are hidden in MDX to streamline your data view. These properties include:
- Numerical dimensions: Properties of type
Number(e.g.,int,bigint,smallint) orDecimal(e.g.,float,double). - String properties containing "Id" or "Key": Any string property whose name includes "Id" or "Key".
Property Visibility allows you to make these hidden properties visible in Excel, ensuring you have access to all the data you need.
Steps to Set Property Visibility:
1. Access the Ontology Tags:
- Go to your Timbr environment and open your data model in the Ontology Explorer.
- Click on Manage Ontology Tags in the top-right corner.
2. Add a New Tag:
- Click Add New Tag.
3. Configure the Tag Details:
- Target Type: Property
- Target Entity: Select the property you want to make visible (e.g.,
order_idorcustomer_key). - Tag Name:
- Use
mdx.visibility(for MDX only) orvisibility(for all tools).
- Use
- Value: visible
Example for MDX-only:
 Target Type: Property
 Target Entity: order_id
 Tag Name: mdx.visibility
 Value: visible
Example for all tools:
  Target Type: Property
  Target Entity: order_id
  Tag Name: visibility
  Value: visible
In addition to visible, you can also use the value hidden to hide properties that are visible by default.
4. Save the tag.

5. Connect in Microsoft Excel:
- Open Microsoft Excel.
- Go to the Data ribbon.
- Click on Get Data > From Database > From Analysis Services to connect to the database.
- In the pop-up window, enter the following credentials:
- Server Name: Your Timbr environment URL with
/MDXappended.- Example:
https://your-timbr-environment-url/MDX
- Example:
- Username:
token@<model-name>- Example:
token@Supply_Metrics
- Example:
- Password: Paste your Timbr access token.
- Click Next to proceed.
- Server Name: Your Timbr environment URL with
For detailed instructions on entering credentials, refer to the Connecting to Timbr MDX Endpoint from Microsoft Excel section above.
6. Select the Concept Containing the Property to Load as a Cube
- Once connected, Excel will display the available concepts from your semantic model.
- Select the concept that contains the property you made visible (e.g., Order) to load it as an OLAP cube.
- Click Finish to proceed.
7. Customize Your PivotTable
- Excel will prompt you to create a PivotTable.
- In the PivotTable Fields pane, you will see:
- The selected concept's properties and measures, including the newly visible property.
- Any related concepts accessible through relationships.
- Drag and drop properties and measures into the Rows, Columns, or Values areas to analyze data seamlessly, now including the previously hidden property.

If you make changes in Timbr (e.g., adding visibility tags), remember to click Refresh in the Data ribbon in Excel to update the available metadata.
Failing to refresh may result in discrepancies and prevent newly added concepts, properties, and relationships from appearing, as the tags will not take effect.
Configuring Property/Concept Labels Using Tags
By default, properties and concepts in MDX use their names as defined in the data model. However, you can customize these labels to make them more user-friendly or aligned with business terminology.
Property/Concept Labels allow you to:
- Replace technical property names with meaningful labels (e.g.,
order_id→Order ID). - Simplify concept names for better readability in Excel.
1. Access the Ontology Tags:
- Go to your Timbr environment and open your data model in the Ontology Explorer.
- Click on Manage Ontology Tags in the top-right corner.
2. Add a New Tag:
- Click Add New Tag.
3. Configure the Tag Details:
- Target Type:
- Use
Conceptto modify a concept label. - Use
Propertyto modify a property label.
- Use
- Target Entity: Select the concept or property to customize (e.g.,
order_idoreurope_order). - Tag Name:
- Use
mdx.label(for MDX only) orlabel(for all tools).
- Use
- Value: The label you want to display in Excel.
Example for MDX-only:
  Target Type: Property
  Target Entity: order_id
  Tag Name: mdx.label
  Value: Order ID
Example for all tools:
  Target Type: Property
  Target Entity: order_id
  Tag Name: label
  Value: Order ID
4. Save the tag.

5. Connect in Microsoft Excel:
- Open Microsoft Excel.
- Go to the Data ribbon.
- Click on Get Data > From Database > From Analysis Services to connect to the database.
- In the pop-up window, enter the following credentials:
- Server Name: Your Timbr environment URL with
/MDXappended.- Example:
https://your-timbr-environment-url/MDX
- Example:
- Username:
token@<model-name>- Example:
token@Supply_Metrics
- Example:
- Password: Paste your Timbr access token.
- Click Next to proceed.
- Server Name: Your Timbr environment URL with
For detailed instructions on entering credentials, refer to the Connecting to Timbr MDX Endpoint from Microsoft Excel section above.
6. Select the Concept Containing the Property/Concept with a Custom Label:
- Once connected, Excel will display the available concepts from your semantic model.
- Select the concept containing the custom-labeled property or concept (e.g., Order) to load it as an OLAP cube.
- Click Finish to proceed.
7. Verify the Custom Labels in Excel:
- Excel will prompt you to create a PivotTable.
- In the PivotTable Fields pane, you will see:
- The selected concept's properties and measures, including any custom labels you have defined for properties or concepts, replacing their original names.
- Drag and drop properties and measures into the Rows, Columns, or Values areas to analyze data seamlessly, now including the custom labels if defined.

If you make changes in Timbr (e.g., adding or modifying labels), remember to click Refresh in the Data ribbon in Excel to update the available metadata.
Failing to refresh may result in discrepancies and prevent newly added concepts, properties, and relationships from appearing, as the tags will not take effect.